Category:French-language charts
Jump to navigation
Jump to search
Français : Cette catégorie rassemble les graphiques (courbes, histogrammes, diagrammes circulaires, etc.) en français.
- Les schémas/dessins/diagrammes vont dans la catégorie French-language diagrams.
- Les cartes et les plans vont dans la catégorie French-language maps.
Subcategories
This category has the following 2 subcategories, out of 2 total.
*
F
Media in category "French-language charts"
The following 200 files are in this category, out of 246 total.
(previous page) (next page)-
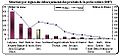
 % DE DIFFERENCE DE SALAIRE ENTRE HOMME ET FEMME.jpg 597 × 290; 29 KB
-
 0 ressort energie elementaire.png 812 × 604; 7 KB
-
 04 loubier INRAE.png 600 × 339; 24 KB
-
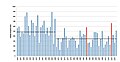
 1 guadeloupe pesticides.jpg 1,321 × 701; 136 KB
-
 1.41.JPG 608 × 511; 28 KB
-
 1850-2019 population bienne.png 600 × 500; 8 KB
-
 1996a01-1999 DemandeursEnploiInscrits.jpg 1,260 × 942; 144 KB
-
 2001a01-2005 DemandeursEnploiInscrits.jpg 1,262 × 782; 140 KB
-
 5 secteurs.JPG 828 × 233; 27 KB
-
 Absys.jpg 720 × 528; 43 KB
-
 Adam à Noé.jpg 1,323 × 264; 77 KB
-
 Aide conventionnelle.png 640 × 480; 5 KB
-
 Air Urbaine Strasbourg - Evolution de la population.png 864 × 509; 20 KB
-
 Allele-frequency-fr.png 3,114 × 2,837; 510 KB
-
 Althing 2009.png 886 × 564; 119 KB
-
 Anniversaires.jpeg 400 × 400; 17 KB
-
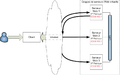
 Archi clusterWeb.png 911 × 572; 40 KB
-
 Archi clusterWebVirtuel.png 911 × 572; 44 KB
-
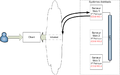 Archi SysDis.png 911 × 572; 42 KB
-
 Armées des grandes puissances.jpg 3,855 × 3,666; 9.44 MB
-
 Arroyo Grande - pyramide des âges.jpg 970 × 603; 44 KB
-
 Article par million d'habitants.jpg 2,048 × 686; 82 KB
-
 Audiences TV 2017.png 720 × 320; 37 KB
-
 Avantages du cloud computing.jpg 513 × 376; 51 KB
-
 Banque.PNG 514 × 295; 11 KB
-
 Bench result.png 577 × 244; 16 KB
-
 Bxl-evolution-linguistique.gif 726 × 444; 48 KB
-
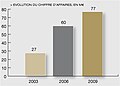 CA-2003-2009.jpg 452 × 325; 28 KB
-
 Cartogramme des élections fédérales canadiennes de 2021.svg 1,782 × 814; 287 KB
-
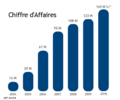
 Chiffre affaires.jpg 320 × 234; 20 KB
-
 Chiffres-CA-grand.png 281 × 235; 12 KB
-
 Chiffres-collaborateurs-grand.png 312 × 235; 14 KB
-
 Ci-elections-graphique.jpg 942 × 850; 159 KB
-
 Classement 11e journée.jpg 957 × 573; 39 KB
-
 Classement 7e journée.jpg 950 × 583; 41 KB
-
 Clubs de rugby à XV-1.jpg 841 × 501; 39 KB
-
 Coherence-cardiaque.png 389 × 295; 35 KB
-
 Cohesionsociale.jpg 881 × 407; 86 KB
-
 Coin fiscal OCDE.png 1,166 × 673; 51 KB
-
 Coin fiscalo-social 2011.png 1,531 × 952; 93 KB
-
 Commerce extérieur des marchandises suisse à prix constant.png 911 × 623; 34 KB
-
 Conique distances.png 214 × 72; 2 KB
-
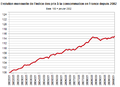
 Conso élec par secteur Italie.jpg 442 × 302; 27 KB
-
 Conso énergie secteur États-Unis.jpg 416 × 284; 25 KB
-
 Contributions Dingy.PNG 970 × 601; 23 KB
-
 Courbe croissance Bizalion.png 766 × 488; 47 KB
-
 Courbe de croissance bizalion.png 637 × 404; 39 KB
-
 Courbe de vie Bizalion.jpg 767 × 433; 64 KB
-
 CourbeChien.JPG 641 × 490; 18 KB
-
 CrabeCancer pagurusPressionPêche.jpg 569 × 387; 38 KB
-
 Cumul allocation revenus.png 640 × 480; 5 KB
-
 DettePubliqueFrance.jpg 1,089 × 607; 82 KB
-
 Diagramme énergie.jpg 386 × 387; 65 KB
-
 Diagramme-revenus.jpg 614 × 833; 156 KB
-
 Diagramme-stabilite-quadripole.png 767 × 394; 11 KB
-
 Digramstat-fr.PNG 742 × 381; 18 KB
-
 Distances debits reseaux sans fil.png 535 × 510; 37 KB
-
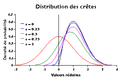 Distribution des crêtes.png 314 × 206; 4 KB
-
 Effectif-2003-2009.jpg 350 × 244; 17 KB
-
 Elections législatives islandaises 2007.png 450 × 228; 28 KB
-
 Emissions GES par habitant.JPG 658 × 378; 39 KB
-
 Emissions GES particuliers-entreprises.JPG 483 × 291; 22 KB
-
 Entrée de camions dans la bande de Gaza via Israël entre 2009 et 2019.png 968 × 1,180; 195 KB
-
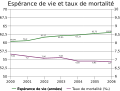
 Espérance de vie Taux mortalité Nauru.png 492 × 361; 18 KB
-
 Espérance de vie Taux mortalité Taux mortalité infantile Nauru.png 490 × 361; 20 KB
-
 Essai sur la statistique morale de la France, Plate VII, 1833.jpg 1,823 × 2,337; 3.95 MB
-
 Evol Barre Admissibilite.jpg 970 × 604; 847 KB
-
 Evolution comparée de la durée du droit d'auteur et de l'espérance de vie.png 1,313 × 605; 148 KB
-
 Evolution concentration.jpg 425 × 459; 13 KB
-
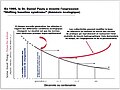
 Evolution de l'inflation en Turquie.png 944 × 625; 150 KB
-
 Evolution de la population vertoise 1801 maintenant.JPG 858 × 284; 35 KB
-
 Evolution de la production des vérins.png 629 × 178; 25 KB
-

-
 Evolution marchandises le havre.jpg 868 × 763; 93 KB
-
 Evolution population oran-fr.png 660 × 530; 29 KB
-
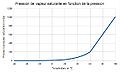
 Evolution-pression-fonction-altitude.JPG 606 × 435; 24 KB
-
-
 ExpectedAIDSage.png 485 × 238; 13 KB
-
 Fabricants.png 994 × 364; 20 KB
-
 Facebook users fr.png 710 × 459; 17 KB
-
 Facteur de multiplication des bacteries.png 690 × 364; 5 KB
-
 Fig.2.jpg 924 × 641; 121 KB
-
 Flux de la conversation.jpg 815 × 468; 41 KB
-

-
 FR epa service 2003-2009 average image output per day.png 977 × 600; 25 KB
-
 FR epa service 2003-2010 average image output per day.png 977 × 600; 26 KB
-
 FR epa service 2010.png 911 × 623; 52 KB
-
 France AssembleeNationale 1967.png 700 × 600; 31 KB
-
 France AssembleeNationale 1968.png 700 × 600; 30 KB
-
 France AssembleeNationale 1973.png 700 × 600; 33 KB
-
 France AssembleeNationale 1981.png 700 × 600; 26 KB
-
 France AssembleeNationale 1986.png 700 × 600; 29 KB
-
 France AssembleeNationale 1988.png 700 × 600; 30 KB
-
 France AssembleeNationale 1993.png 700 × 600; 29 KB
-
 France AssembleeNationale 1997.png 700 × 600; 28 KB
-
 Frost azote pH0.png 645 × 474; 9 KB
-
 Frost chlore.png 632 × 362; 5 KB
-
 GalacticRotation (french).png 1,024 × 724; 52 KB
-
 Geo iceland use.png 742 × 589; 81 KB
-
 Global Trade Freedom Needs a Boost 2.JPG 1,295 × 416; 79 KB
-
 GPB Sénat.png 693 × 431; 21 KB
-
 Graph pop MSA Floride 1990-2007.svg 518 × 359; 80 KB
-
 Graphe 2.PNG 618 × 507; 20 KB
-
 Graphique - nombre de vraquiers.png 700 × 450; 35 KB
-
 Graphique collége evreux par type d'enseignement.png 575 × 338; 9 KB
-
 Graphique daniel pauty shifting baseline traduit.jpg 2,048 × 1,535; 297 KB
-
 Graphique Etude Steele et Aronson.png 416 × 293; 46 KB
-
 Graphique Marjoristes.jpg 600 × 436; 34 KB
-
 Graphiqueste.jpg 3,623 × 2,261; 618 KB
-
 Gravitational Acceleration Earth (french).png 512 × 336; 25 KB
-
 Henry 4 biz den.jpg 429 × 328; 43 KB
-
 Histogramme IDH 2021.svg 576 × 432; 30 KB
-
 Illustration de cette théorie économique.png 993 × 993; 317 KB
-
 Illustration théorie du donut.svg 744 × 1,052; 1.04 MB
-
 Infiltro courbe.jpg 721 × 526; 60 KB
-
 Infiltro courbe2.jpg 721 × 526; 81 KB
-
 Inflation 2002 a.png 480 × 346; 33 KB
-
 Inflation 2002 b.png 480 × 346; 43 KB
-
 Inflation 2002 c.png 480 × 346; 58 KB
-
 Inflation 2002.png 480 × 346; 24 KB
-
 Injectivité de la formule donnant la différence de phase.png 789 × 538; 38 KB
-
 Intensité énergétique.png 898 × 609; 71 KB
-
 Intensités-In+1-f(In)-4.png 1,678 × 1,892; 6.65 MB
-
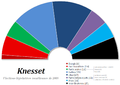 Knesset 2009.png 917 × 653; 52 KB
-
 L'âge des religons.jpg 3,764 × 3,600; 7.66 MB
-
 L-homme-vers-la-tour4.pdf 1,358 × 1,527; 7 KB
-
 Lafreniere.JPG 512 × 400; 28 KB
-
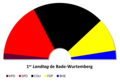 Landtag 1 BW.png 953 × 659; 45 KB
-
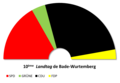 Landtag 10 BW.png 953 × 659; 45 KB
-
 Landtag 11 BW.png 953 × 659; 48 KB
-
 Landtag 12 BW.png 953 × 659; 48 KB
-
 Landtag 13 BW.png 953 × 659; 43 KB
-
 Landtag 14 BW.png 953 × 656; 45 KB
-
 Landtag 2 BW.png 953 × 659; 45 KB
-
 Landtag 3 BW.png 953 × 656; 45 KB
-
 Landtag 4 BW.png 953 × 656; 42 KB
-
 Landtag 5 BW.png 953 × 659; 45 KB
-
 Landtag 6 BW.png 953 × 659; 42 KB
-
 Landtag 7 BW.png 953 × 659; 42 KB
-
 Landtag 8 BW.png 953 × 659; 45 KB
-
 Landtag 9 BW.png 953 × 659; 44 KB
-
 Landtag Saxe 2009.png 886 × 612; 126 KB
-
 Le taux de fécondité en Russie de 1990 à 2008.png 775 × 496; 69 KB
-
 Le taux de reussite.JPG 595 × 370; 34 KB
-
 LeitzinsenFR.png 1,370 × 900; 43 KB
-
 Les dix principales quotes-parts du FMI.GIF 485 × 333; 13 KB
-
 Loi de Moore.png 900 × 625; 26 KB
-
 Lég73.jpg 780 × 410; 45 KB
-
 Maped.png 670 × 519; 12 KB
-
 Marque de distributeur.png 957 × 341; 35 KB
-
 Mars-Science-Laboratory-Mars-Entry-Trajectory-fr.png 1,600 × 1,219; 36 KB
-
 MEDAF.pdf 1,239 × 1,754; 16 KB
-
 Mesures absys.jpg 710 × 449; 232 KB
-
 Metac.png 1,209 × 737; 51 KB
-
 Modèle de Berlin.jpg 250 × 300; 30 KB
-
 Nauru life-expectancy-childrens-death-rate fr.svg 841 × 671; 61 KB
-
 Nauru life-expectancy-death-rate fr.svg 855 × 646; 71 KB
-
 Nitrate age.jpg 424 × 342; 12 KB
-
 Niveaux de sélection.png 973 × 306; 89 KB
-
 Nombre doses vaccin cumulé 2022.png 3,652 × 2,653; 681 KB
-
 Nombre labels jeu vidéo WP fr.gif 700 × 230; 27 KB
-
 Nomenclatures asie europe.png 682 × 600; 294 KB
-
 NOPLP Tournoi-des-maestros (2020).png 1,186 × 511; 86 KB
-
 NOPLP Tournoi-des-maestros (2021).png 1,186 × 511; 65 KB
-

-
 Number of underage executed since 1990(fr).png 629 × 399; 4 KB
-
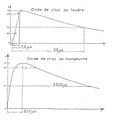 Ondes de choc.jpg 368 × 383; 12 KB
-
 P che SMD.jpg 488 × 228; 27 KB
-
 Parlement palestinien après les élections de janvier 2005.PNG 620 × 502; 42 KB
-
 Pertes militaires de la Seconde Guerre Mondiale en Europe.png 1,394 × 716; 131 KB
-
 Pesticides france 2006.jpg 702 × 449; 104 KB
-
 Pesticides intensité france 2006.jpg 1,028 × 635; 150 KB
-
 Pesticides UE 6 selon UIPP2.jpg 1,074 × 587; 225 KB
-
 PIB par habitant entre deux guerre.gif 1,535 × 954; 32 KB
-
 Pilapilianboy.jpg 600 × 400; 25 KB
-
 PiquageCollecteur fig 8.JPG 490 × 396; 18 KB
-
 Pluie2.jpeg 804 × 415; 47 KB
-
 Polaire parapente otzi.png 763 × 400; 16 KB
-
 Population du bassin du Sénégal.jpg 970 × 603; 27 KB
-
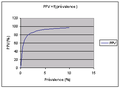 PPV-prev.png 305 × 224; 2 KB
-
 PQpourLCC.png 933 × 958; 19 KB
-
 Pression de vapeur saturante.jpg 1,150 × 694; 62 KB
-
 Prise de parole des participants.jpg 896 × 481; 59 KB
-
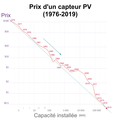 Prix d'un capteur photovoltaïque (1976-2019).png 2,000 × 2,100; 240 KB
-
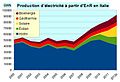 Prod élec EnR Italie.jpg 442 × 302; 24 KB
-
 Producteurs.png 994 × 364; 31 KB
-
 Profil écologique de systèmes de chauffage (3).jpg 850 × 800; 87 KB
-
 ProfilChamps.jpg 614 × 732; 75 KB
-
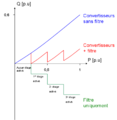
 Profit espere du vendeur de journaux.png 723 × 447; 40 KB
-
 Profondeur age.jpg 447 × 400; 20 KB
-
 ProjBonne.jpg 1,164 × 768; 300 KB
-
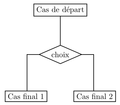 Pstricks exo organigramme simple.png 319 × 279; 9 KB
-
 Pyramide Azerbaidjan.PNG 902 × 625; 35 KB
-
 QMU marge incertitude.png 685 × 570; 9 KB
-
 QuestionsOracle.png 815 × 507; 8 KB
-
 R407-differents melanges-fr.png 1,024 × 414; 75 KB
-
 RAacceptées brouillon.png 434 × 337; 15 KB
-
 Relation Zéro absolu, Chaleur, Agitation des particules-fr.jpg 710 × 647; 72 KB
-
 Représentation graphique.png 966 × 692; 145 KB
-
 Riksdag 2010.png 1,188 × 854; 77 KB


.png)


.png)


-4.png)


.png)
.png)

.png)


.png)

.jpg)


