Category:Food statistics
Jump to navigation
Jump to search
Subcategories
This category has the following 9 subcategories, out of 9 total.
C
D
E
F
M
S
W
Media in category "Food statistics"
The following 85 files are in this category, out of 85 total.
-
 Animal-protein-consumption (OWID 0070).png 850 × 600; 73 KB
-
 Animal-protein-vs-gdp (OWID 0069).png 850 × 600; 98 KB
-
 Area-land-needed-to-global-oil (OWID 0089).png 850 × 600; 65 KB
-
 Beef-and-buffalo-meat-production-tonnes (OWID 0080).png 850 × 600; 105 KB
-
 Cattle-livestock-count-heads (OWID 0116).png 850 × 600; 95 KB
-
 Cattle-meat-yields-hectograms-100-grams-per-animal (OWID 0115).png 850 × 600; 93 KB
-
 Cereal Self-sufficiency ratio.png 754 × 565; 51 KB
-
 Change-in-production-yield-and-land-palm (OWID 0156).png 850 × 600; 58 KB
-
 Comparison of dietary fat composition.svg 570 × 348; 6 KB
-
 Daily per-capita food energy supply of countries.svg 850 × 600; 62 KB
-
 Daily per-capita food energy supply of regions.svg 850 × 600; 68 KB
-
 Daily protein supply of animal origin vs. plant origin, OWID.svg 850 × 600; 36 KB
-
 Daily-caloric-supply-derived-from-carbohydrates-protein-and-fat.png 3,400 × 2,400; 468 KB
-
 Daily-per-capita-protein-supply-vs-gdp-per-capita (OWID 0209).png 850 × 600; 103 KB
-
 Daily-protein-supply-of-animal-origin-vs-plant-origin (OWID 0206).png 850 × 600; 110 KB
-
 Dietary compositions by commodity group, OWID.svg 850 × 600; 28 KB
-
 Dietary-choices-of-british-adults (OWID 0291).png 850 × 600; 75 KB
-
 Dietary-choices-of-british-adults.svg 850 × 600; 32 KB
-
 Dietary-choices-uk (OWID 0292).png 850 × 600; 68 KB
-
 Dietary-land-use-vs-beef-consumption (OWID 0288).png 850 × 600; 98 KB
-
 Eat-lancet-diet-animal-products (OWID 0274).png 850 × 600; 85 KB
-
 Eat-lancet-diet-comparison (OWID 0275).png 850 × 600; 92 KB
-
 Emission-factors-food-transport (OWID 0376).png 850 × 600; 54 KB
-
 Emissions-from-food (OWID 0377).png 850 × 600; 100 KB
-
 Environmental-footprint-milks (OWID 0348).png 850 × 600; 83 KB
-
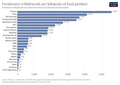
 Eutrophying-emissions-kcal (OWID 0346).png 850 × 600; 76 KB
-
 Eutrophying-emissions-per-kg-poore (OWID 0347).png 850 × 600; 83 KB
-
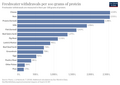
 Eutrophying-emissions-protein (OWID 0344).png 850 × 600; 80 KB
-
 FAO kcal his JA.png 754 × 565; 61 KB
-
 FAO kcal his.png 625 × 433; 52 KB
-
 Food expenditure per person, OWID.svg 850 × 600; 8 KB
-
 Food Price Index.webp 1,550 × 452; 76 KB
-
 Food Self-sufficiency ratio (English).png 755 × 564; 57 KB
-
 Food Self-sufficiency ratio.png 755 × 564; 50 KB
-
 Food supply vs life expectancy, OWID.svg 850 × 600; 34 KB
-
 Food waste by supply chain stage, OWID.svg 850 × 600; 4 KB
-
 Food-emissions-production-supply-chain (OWID 0422).png 850 × 600; 75 KB
-
 Food-emissions-supply-chain (OWID 0423).png 850 × 600; 87 KB
-
 Food-share-total-emissions (OWID 0421).png 850 × 600; 116 KB
-
 Food-transport-emissions (OWID 0419).png 850 × 600; 52 KB
-
 Food-waste-in-supply-chains (OWID 0415).png 850 × 600; 57 KB
-
 Food-waste-per-capita (OWID 0412).png 850 × 600; 46 KB
-
 FreeRiceDonations.PNG 527 × 345; 12 KB
-
 Freshwater-withdrawals-per-1000kcal (OWID 0487).png 850 × 600; 68 KB
-
 Ghg-kcal-poore (OWID 0477).png 850 × 600; 83 KB
-
 Ghg-per-kg-poore (OWID 0476).png 850 × 600; 86 KB
-
 Ghg-per-protein-poore (OWID 0475).png 850 × 600; 61 KB
-
 Global-food-waste-by-region (OWID 0545).png 850 × 600; 56 KB
-
 Global-meat-production (OWID 0536).png 850 × 600; 62 KB
-
 Kaloriengehalt.png 1,054 × 708; 12 KB
-
 Land-use-kcal-poore (OWID 0585).png 850 × 600; 77 KB
-
 Land-use-per-kg-poore (OWID 0586).png 850 × 600; 75 KB
-
 Land-use-protein-poore (OWID 0583).png 850 × 600; 60 KB
-
 Meat-consumption-vs-gdp-per-capita (OWID 0668).png 850 × 600; 106 KB
-
 Milk-production-tonnes (OWID 0660).png 850 × 600; 104 KB
-
 Milk-yields-per-animal (OWID 0657).png 850 × 600; 101 KB
-
 MyasoRF.png 564 × 366; 16 KB
-
 Number-of-people-moderately-or-severely-food-insecure (OWID 0728).png 850 × 600; 116 KB
-
 Number-of-people-severely-food-insecure (OWID 0726).png 850 × 600; 110 KB
-
 Number-undernourished (OWID 0717).png 850 × 600; 63 KB
-
 Palm-oil-imports (OWID 0681).png 850 × 600; 92 KB
-
 Per-capita-food-losses-waste (OWID 0765).png 850 × 600; 68 KB
-
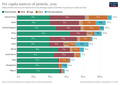 Per-capita-sources-of-protein (OWID 0856).png 850 × 600; 73 KB
-
 PerCapita Consumption - Organic Foods.png 639 × 377; 46 KB
-
 PH Scale Foods He.png 847 × 1,719; 217 KB
-
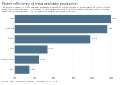 Protein efficiency of meat and dairy production, OWID.svg 850 × 600; 5 KB
-
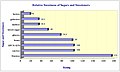
 Protein supply by region, OWID.svg 850 × 600; 24 KB
-
 Relativesweetness.jpg 1,228 × 733; 280 KB
-
 Relativesweetness.svg 512 × 330; 10 KB
-
 Scarcity-water-per-kg-poore (OWID 0955).png 850 × 600; 82 KB
-
 Scarcity-water-protein-poore (OWID 0957).png 850 × 600; 70 KB
-
 Scarcity-water-use-kcals (OWID 0958).png 850 × 600; 77 KB
-
 Share-global-food-emissions (OWID 1013).png 850 × 600; 120 KB
-
-
 SNAP benefits.png 1,417 × 596; 60 KB
-
 СКОР горохового белка.png 902 × 778; 42 KB
-
 СКОР овсяного белка.png 901 × 778; 41 KB
-
 Statistik küchenkräuter und gewürzpflanzen 2007-2013.png 712 × 395; 40 KB
-
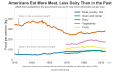
 US Consumption of Meat, Poultry, and Fish.svg 900 × 540; 75 KB
-
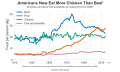
 US Food Consumption Over Time.svg 900 × 540; 82 KB
-
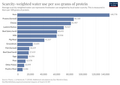
 Water requirement per gram of protein, OWID.svg 850 × 600; 7 KB
-
 Water requirement per kilocalorie, OWID.svg 850 × 600; 9 KB
-
 Water-per-protein-poore (OWID 1116).png 850 × 600; 60 KB
-
 Water-withdrawals-per-kg-poore (OWID 1115).png 850 × 600; 71 KB
-
 Wild-fish-catch-gear-type.svg 850 × 600; 49 KB
.png)
.png)
.png)
.png)
.png)
.png)

.png)


.png)
.png)

.png)

.png)
.png)
.png)
.png)
.png)
.png)
.png)
.png)
.png)


.png)


.png)
.png)
.png)
.png)
.png)

.png)
.png)
.png)
.png)
.png)
.png)

.png)
.png)
.png)
.png)
.png)
.png)

.png)
.png)
.png)
.png)
.png)
.png)


.png)
.png)
.png)
.png)
.png)


.png)
.png)

.png)
.png)