Category:Finance charts
Jump to navigation
Jump to search
Financial Diagrams showing graphical presentations of historical financial data.
Subcategories
This category has the following 4 subcategories, out of 4 total.
Media in category "Finance charts"
The following 200 files are in this category, out of 397 total.
(previous page) (next page)-
0015 - Leverage-Effekt-0..png 1,068 × 954; 38 KB
-
0019 - Lohmann-Ruchti-Effekt-3.png 1,419 × 842; 63 KB
-
0019 - Lohmann-Ruchti-Effekt-4.png 1,426 × 845; 92 KB
-
0020 - WACC-2.png 1,326 × 927; 98 KB
-
10-year minus 3-month US Treasury Yields.png 1,715 × 811; 114 KB
-
200907 big smx eur.png 600 × 350; 23 KB
-
401(k) Guthaben.png 975 × 627; 29 KB
-
401k-historical-chart.jpg 576 × 395; 90 KB
-
Abschreibung Bankbilanz Bilanzverkuerzung.PNG 412 × 365; 175 KB
-
Affacturage.png 473 × 305; 38 KB
-
Affacturage.svg 560 × 400; 13 KB
-
Animated-paulflow-dec-16th.gif 950 × 300; 183 KB
-
Annuity 0001.pdf 1,239 × 333; 50 KB
-
Annuity 0001.svg 744 × 200; 11 KB
-
Annuity 0002.pdf 1,239 × 333; 50 KB
-
Annuity 0003 2.pdf 1,239 × 833; 51 KB
-
Annuity 0003.svg 744 × 500; 20 KB
-
Annuity 0004.pdf 1,239 × 833; 51 KB
-
Anweisung 2.png 535 × 291; 8 KB
-
Anweisung wechsel.png 535 × 291; 8 KB
-
Arbre Binomial Options Reelles.png 537 × 314; 27 KB
-
Asset transform.jpg 720 × 540; 52 KB
-
Atlantic Grupa Key Figures 2015.jpg 886 × 896; 101 KB
-
Atlantic Grupa Key Figures 2016.png 1,211 × 767; 88 KB
-
Ausfallraten Bemmann.png 1,200 × 553; 60 KB
-
Ball brown martineau.svg 734 × 486; 12 KB
-
Bankbilanz (stilisiert) Veränderung bei Abschreibung.PNG 485 × 353; 138 KB
-
Banques ma 2K12.jpg 599 × 404; 31 KB
-
Basic price ceiling hi.svg 300 × 300; 1 KB
-
Beispiel ISMA.jpg 518 × 345; 29 KB
-
Bemmann Optionspreismodell.PNG 1,228 × 635; 45 KB
-
Beneficio marginale debito graham 2000.PNG 658 × 384; 9 KB
-
Benutzer friedrich.kromberg wech 1.png 1,664 × 603; 33 KB
-
Betavex.JPG 640 × 512; 14 KB
-
Bilan comptable suite à un prêt avec intermédiation bancaire.png 856 × 1,026; 42 KB
-
Bilan comptable suite à un prêt avec intermédiation financière.png 857 × 1,026; 42 KB
-
Bilan comptable suite à un prêt sans intermédiation financière.png 505 × 689; 19 KB
-
Bild 1 Sensitivitätsdiagramm IKV.PNG 893 × 837; 68 KB
-
Bild 2 Sensitivitätsdiagramm Kapitalwert.PNG 892 × 837; 55 KB
-
Bondholders.PNG 464 × 437; 6 KB
-
British government support for national railway 1985-2015.svg 900 × 457; 31 KB
-
Bundeswertpapiere.png 555 × 305; 4 KB
-
Butterfly-Auszahlungsdiagramm.png 500 × 500; 11 KB
-
CalculDMI.jpg 1,208 × 675; 136 KB
-
CapitalMarketModels.jpg 1,600 × 1,236; 1.69 MB
-
CBDC stylized Balance Sheet (Digitales Zentralbankgeld).png 1,668 × 742; 102 KB
-
CBDC vs Cash vs Book (Giro) Money - liabilities and claims.png 1,752 × 720; 106 KB
-
CBOE Volatlity Index, VIX.png 2,025 × 1,458; 758 KB
-
CeFi vs DeFi.jpg 4,000 × 3,111; 216 KB
-
Chartsnyssa.PNG 726 × 376; 24 KB
-
Chart日経平均.png 543 × 319; 6 KB
-
Climate Funds.jpg 595 × 510; 50 KB
-
Closing accounts.jpg 527 × 391; 34 KB
-
College Tuition State Funding.svg 557 × 388; 25 KB
-
Combined Price Data for Five TVSs and Underlying ($).png 924 × 655; 60 KB
-
COMPUTATIONAL FINANCE.jpg 960 × 720; 99 KB
-
Conceptual framework of accounting.jpg 665 × 558; 68 KB
-
Construction of a micropayment channel.jpg 919 × 210; 92 KB
-
Contango Wikipedia.png 769 × 363; 8 KB
-
Contangobackwardation.png 1,331 × 986; 129 KB
-
Correlations PD Exposure.svg 1,421 × 423; 27 KB
-
Cost of delay.png 340 × 225; 9 KB
-
Cost of tuition in 2008-2009.PNG 1,122 × 816; 38 KB
-
CPPI Portfolio Percent in Risky Asset.jpg 715 × 487; 84 KB
-
Credit-score-chart.svg 600 × 400; 11 KB
-
Création monétaire sans banque centrale - avec une seule banque.png 982 × 867; 45 KB
-
Création monétaire sans banque centrale - cas historique.png 1,191 × 547; 35 KB
-
CSS Dividend.png 680 × 560; 16 KB
-
CSS equilibrium color.png 326 × 275; 3 KB
-
Cхема финансового лизинга.jpg 514 × 289; 59 KB
-
Danove-prijmy-dph.png 1,686 × 663; 53 KB
-
DCFSchema.svg 813 × 400; 30 KB
-
Decision tree.png 914 × 783; 38 KB
-
Dekomposition AUCCAP Bemmann.png 800 × 525; 53 KB
-
DeviationLKOHSIBN.jpg 634 × 225; 26 KB
-
DeviationSigmaLKOHSIBN.jpg 638 × 356; 33 KB
-
Dex Liquidity Curve.png 2,048 × 2,048; 150 KB
-
Directional-change dissection procedure.png 2,012 × 1,226; 875 KB
-
DivergenceStochastiqueCours.jpg 937 × 683; 346 KB
-
Diversification à 2 Actifs (MEDAF-CAPM).jpg 324 × 263; 15 KB
-
DMI Calculé.jpg 1,208 × 675; 135 KB
-
E-value ViA Eco illustration.png 749 × 349; 37 KB
-
EBIT-Marge bis 2021.png 422 × 611; 194 KB
-
Eco 3.png 339 × 220; 31 KB
-
Efecte ruchti lohmann.png 1,154 × 583; 27 KB
-
Effet de levier - schéma explicatif.png 600 × 374; 10 KB
-
Emanuel Uniform Price Auction.jpg 978 × 596; 125 KB
-
Erwerbslosenquote 1995-1998.GIF 647 × 403; 10 KB
-
Esquema bursatilización.jpg 1,246 × 468; 32 KB
-
EU Digital Identity to apply for a bank loan (EUDI).png 973 × 706; 418 KB
-
European Unified Ledger (Banque de France 2024).png 863 × 511; 202 KB
-
EuropeanEmissionTradingSystemPeriodOnePriceHistory.png 789 × 552; 45 KB
-
Eurozone government bonds yield.png 970 × 604; 31 KB
-
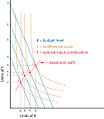
Expansion-path.jpg 464 × 533; 92 KB
-
F.I. Example.jpg 507 × 445; 57 KB
-
Factores que motivan a la gerencia de valor dani - dani.jpg 1,350 × 1,185; 225 KB
-
Factoring dataflyt.jpg 1,100 × 600; 103 KB
-
Factoring-de.svg 542 × 400; 57 KB
-
Factoring-Dreieck.jpg 3,132 × 3,144; 1.44 MB
-
Factoring-gedesco-grafica.png 661 × 239; 19 KB
-
Family Office Servizi.jpg 645 × 556; 198 KB
-
Family-office-organigramme.jpg 647 × 556; 151 KB
-
FCR JP m.png 3,200 × 2,400; 45 KB
-
FCR JP y.png 3,200 × 2,400; 57 KB
-
Fiat Money pic by ECB 2015.2017.png 1,056 × 339; 28 KB
-
Fig3 ServedCommunities.jpg 1,109 × 1,755; 102 KB
-
Fig4 CumulativeAssistance.jpg 1,200 × 510; 56 KB
-
Fig5 CWSRFsReturn.jpg 2,190 × 924; 151 KB
-
Figure grecques.png 1,133 × 835; 77 KB
-
Figure1MA.png 510 × 312; 66 KB
-
Figure2MA.png 495 × 133; 12 KB
-
Figure3MA.png 495 × 135; 14 KB
-
Figure4MA.png 488 × 131; 17 KB
-
Figure5MA.png 489 × 129; 11 KB
-
Finance.gif 504 × 391; 3 KB
-
Financial capability literacy.jpg 485 × 290; 21 KB
-
Financni trhy.jpg 960 × 720; 63 KB
-
Finfigs.jpg 1,108 × 1,250; 295 KB
-
Fingerprint Cards Stock Chart.png 1,056 × 646; 65 KB
-
FIRDS ecosystem.svg 673 × 390; 69 KB
-
Firm Value Seppelfricke.png 502 × 633; 52 KB
-
Flowindi.com screen1.png 800 × 333; 152 KB
-
Fluxo financeiro PV pmt n.GIF 343 × 230; 3 KB
-
Fluxo financeiro PV pmt.GIF 327 × 162; 2 KB
-
Forfaiter.gif 444 × 504; 14 KB
-
Forfaiter.png 444 × 504; 25 KB
-
Formule de Black & Sholes.png 495 × 171; 19 KB
-
FRCstructure.png 726 × 390; 137 KB
-
Funding Business Growth Internally.png 500 × 200; 28 KB
-
Funding.png 997 × 672; 65 KB
-
Fuskontr anzahl auslerw.jpg 689 × 471; 69 KB
-
Fuskontr anzahl branchen.jpg 694 × 556; 64 KB
-
Fuskontr anzahl gg ifo.jpg 685 × 500; 77 KB
-
Futures Trading Composition 2019 SVG.svg 1,100 × 1,600; 191 KB
-
Futures Trading Composition 2019.png 1,100 × 1,600; 321 KB
-
Gap de liquidite.png 413 × 220; 2 KB
-
Geldmenge M1 1995-1998.GIF 703 × 520; 14 KB
-
Goals Based Portfolios vs the Efficient Frontier.jpg 741 × 503; 58 KB
-
GPRO 2014-11-17 Time Price Theory Chart with Time Price Coordinates.png 1,000 × 600; 43 KB
-
GPRO2014-10-17.png 1,000 × 600; 44 KB
-
Graf složení anuitních splátek.pdf 1,239 × 1,754; 21 KB
-
Gramm-Leach-Bliley Vote 1999.png 2,500 × 1,441; 139 KB
-
Graph (military spenders).jpg 524 × 255; 80 KB
-
Graph Wikipedia 2.jpg 1,984 × 1,024; 301 KB
-
Graphic-1606688 1280.png 1,920 × 1,330; 221 KB
-
Graphique 5pour-cent.jpg 846 × 551; 102 KB
-
Gross financing needs in percent of GDP.png 1,303 × 511; 80 KB
-
Guckst du.PNG 874 × 435; 28 KB
-
H&S2.GIF 837 × 424; 14 KB
-
Heavy bear.PNG 884 × 596; 35 KB
-
Heavy bull.PNG 859 × 593; 31 KB
-
Hedge Fund 01.png 332 × 261; 7 KB
-
How To Save Infographic.png 1,668 × 2,224; 791 KB
-
IDE FR 1960 2009.JPEG 962 × 721; 113 KB
-
IDE in total 1970 2009.JPG 883 × 702; 89 KB
-
IIA Trends.JPG 503 × 267; 33 KB
-
Inductores grafico.png 698 × 548; 79 KB
-
Interest Risk.svg 620 × 367; 165 KB
-
International tuition fees.png 450 × 335; 9 KB
-
InvestitionsquotenUSAJBRD.PNG 970 × 604; 49 KB
-
Ipsa.png 482 × 256; 4 KB
-
Iso-ROI-lines.jpg 983 × 552; 79 KB
-
Ivsrf.gif 395 × 361; 11 KB
-
Jmflaan.png 880 × 696; 27 KB
-
Kapitalmarkt.jpg 960 × 720; 54 KB
-
Kapitalmarktakteuere-zh.jpg 800 × 600; 102 KB
-
Ken Griffin Federal Political Contributions.png 600 × 371; 23 KB
-
Kernel alma simplified.png 322 × 115; 56 KB
-
Kernel ema simplified.png 323 × 115; 5 KB
-
Kernel hma simplified.png 322 × 115; 5 KB
-
Kernel sma simplified.png 323 × 115; 5 KB
-
Kijun.PNG 1,229 × 595; 40 KB
-
Klassische Repo-Transaktion.png 2,423 × 793; 62 KB
-
Klk-IR1a.png 287 × 264; 4 KB
-
Klk-IR1l.png 287 × 264; 5 KB
-
Klk-IR1s.png 287 × 264; 1,010 bytes
-
Klk-IR2l.png 287 × 264; 6 KB
-
Klk-IR2s.png 287 × 264; 1 KB
-
Klk-IR3l.png 287 × 264; 5 KB
-
Klk-IR3s.png 287 × 264; 3 KB
-
Konstruktionsprinzip eines Reverse Bonuszertifikats.gif 553 × 501; 28 KB
-
Kortnätverk.png 720 × 540; 14 KB
-
Kortnätverk2.png 720 × 540; 13 KB
-
Kreditgewaehrung im Gleichschritt (Giralgeldschöpfung) Gestrich 1936.png 1,437 × 514; 244 KB


