Category:Files uploaded by Effeietsanders/COVID-19
Jump to navigation
Jump to search
These are some files and subcategories for tracking purposes. I am sometimes the creator, and sometimes only the uploader.
Media in category "Files uploaded by Effeietsanders/COVID-19"
The following 151 files are in this category, out of 151 total.
-
COVID-19 Deaths Prevalence in Alabama by county.svg 255 × 400; 51 KB
-
COVID-19 Deaths Prevalence in Alaska by county.svg 400 × 227; 136 KB
-
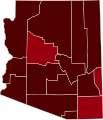
COVID-19 Deaths Prevalence in Arizona by county.svg 345 × 400; 20 KB
-
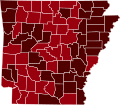
COVID-19 Deaths Prevalence in Arkansas by county.svg 400 × 349; 53 KB
-
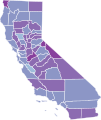
COVID-19 Deaths Prevalence in California by county.svg 338 × 400; 74 KB
-
COVID-19 Deaths Prevalence in Colorado by county.svg 400 × 289; 41 KB
-
COVID-19 Deaths Prevalence in Connecticut by county.svg 400 × 291; 10 KB
-
COVID-19 Deaths Prevalence in Delaware by county.svg 166 × 400; 3 KB
-
COVID-19 Deaths Prevalence in District of Columbia by county.svg 322 × 400; 709 bytes
-
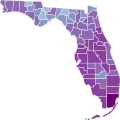
COVID-19 Deaths Prevalence in Florida by county.svg 400 × 399; 56 KB
-
COVID-19 Deaths Prevalence in Georgia by county.svg 347 × 400; 96 KB
-
COVID-19 Deaths Prevalence in Hawaii by county.svg 400 × 261; 10 KB
-
COVID-19 Deaths Prevalence in Idaho by county.svg 252 × 400; 44 KB
-
COVID-19 Deaths Prevalence in Illinois by county.svg 226 × 400; 57 KB
-
COVID-19 Deaths Prevalence in Indiana by county.svg 260 × 400; 45 KB
-
COVID-19 Deaths Prevalence in Iowa by county.svg 400 × 261; 38 KB
-
COVID-19 Deaths Prevalence in Kansas by county.svg 400 × 205; 41 KB
-
COVID-19 Deaths Prevalence in Kentucky by county.svg 400 × 169; 76 KB
-
COVID-19 Deaths Prevalence in Louisiana by county.svg 400 × 377; 56 KB
-
COVID-19 Deaths Prevalence in Maine by county.svg 267 × 400; 27 KB
-
COVID-19 Deaths Prevalence in Maryland by county.svg 400 × 210; 22 KB
-
COVID-19 Deaths Prevalence in Massachusetts by county.svg 400 × 247; 22 KB
-
COVID-19 Deaths Prevalence in Michigan by county.svg 340 × 400; 46 KB
-
COVID-19 Deaths Prevalence in Minnesota by county.svg 350 × 400; 50 KB
-
COVID-19 Deaths Prevalence in Mississippi by county.svg 246 × 400; 52 KB
-
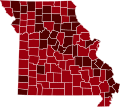
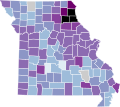
COVID-19 Deaths Prevalence in Missouri by county.svg 400 × 356; 62 KB
-
COVID-19 Deaths Prevalence in Montana by county.svg 400 × 230; 67 KB
-
COVID-19 Deaths Prevalence in Nevada by county.svg 265 × 400; 16 KB
-
COVID-19 Deaths Prevalence in New Jersey by county.svg 211 × 400; 20 KB
-
COVID-19 Deaths Prevalence in New Mexico by county.svg 359 × 400; 26 KB
-
COVID-19 Deaths Prevalence in New York by county.svg 400 × 305; 56 KB
-
COVID-19 Deaths Prevalence in North Carolina by county.svg 400 × 152; 63 KB
-
COVID-19 Deaths Prevalence in North Dakota by county.svg 400 × 238; 30 KB
-
COVID-19 Deaths Prevalence in Ohio by county.svg 370 × 400; 52 KB
-
COVID-19 Deaths Prevalence in Oklahoma by county.svg 400 × 197; 47 KB
-
COVID-19 Deaths Prevalence in Oregon by county.svg 400 × 297; 40 KB
-
COVID-19 Deaths Prevalence in Pennsylvania by county.svg 400 × 230; 45 KB
-
COVID-19 Deaths Prevalence in South Carolina by county.svg 400 × 318; 39 KB
-
COVID-19 Deaths Prevalence in South Dakota by county.svg 400 × 248; 34 KB
-
COVID-19 Deaths Prevalence in Tennessee by county.svg 400 × 97; 62 KB
-
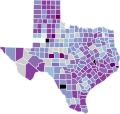
COVID-19 Deaths Prevalence in Texas by county.svg 400 × 380; 160 KB
-
COVID-19 Deaths Prevalence in Utah by county.svg 320 × 400; 28 KB
-
COVID-19 Deaths Prevalence in Vermont by county.svg 243 × 400; 15 KB
-
COVID-19 Deaths Prevalence in Virginia by county.svg 400 × 173; 87 KB
-
COVID-19 Deaths Prevalence in Washington by county.svg 400 × 263; 39 KB
-
COVID-19 Deaths Prevalence in West Virginia by county.svg 400 × 355; 36 KB
-
COVID-19 Deaths Prevalence in Wisconsin by county.svg 375 × 400; 42 KB
-
COVID-19 Prevalence in Alabama by county.svg 255 × 400; 51 KB
-
COVID-19 Prevalence in Alaska by county.svg 400 × 227; 136 KB
-
COVID-19 Prevalence in Arizona by county.svg 345 × 400; 20 KB
-
COVID-19 Prevalence in Arkansas by county.svg 400 × 349; 53 KB
-
COVID-19 Prevalence in California by county.svg 338 × 400; 74 KB
-
COVID-19 Prevalence in Colorado by county.svg 400 × 289; 41 KB
-
COVID-19 Prevalence in Connecticut by county.svg 400 × 291; 10 KB
-
COVID-19 Prevalence in Delaware by county.svg 166 × 400; 3 KB
-
COVID-19 Prevalence in District of Columbia by county.svg 322 × 400; 709 bytes
-
COVID-19 Prevalence in Florida by county.svg 400 × 399; 56 KB
-
COVID-19 Prevalence in Georgia by county.svg 347 × 400; 96 KB
-
COVID-19 Prevalence in Hawaii by county.svg 400 × 261; 12 KB
-
COVID-19 Prevalence in Idaho by county.svg 252 × 400; 44 KB
-
COVID-19 Prevalence in Illinois by county.svg 226 × 400; 57 KB
-
COVID-19 Prevalence in Indiana by county.svg 260 × 400; 45 KB
-
COVID-19 Prevalence in Iowa by county.svg 400 × 261; 38 KB
-
COVID-19 Prevalence in Kansas by county.svg 400 × 205; 41 KB
-
COVID-19 Prevalence in Kentucky by county.svg 400 × 169; 76 KB
-
COVID-19 Prevalence in Louisiana by county.svg 400 × 377; 56 KB
-
COVID-19 Prevalence in Maine by county.svg 267 × 400; 27 KB
-
COVID-19 Prevalence in Maryland by county.svg 400 × 210; 22 KB
-
COVID-19 Prevalence in Massachusetts by county.svg 400 × 247; 22 KB
-
COVID-19 Prevalence in Michigan by county.svg 340 × 400; 46 KB
-
COVID-19 Prevalence in Minnesota by county.svg 350 × 400; 50 KB
-
COVID-19 Prevalence in Mississippi by county.svg 246 × 400; 52 KB
-
COVID-19 Prevalence in Missouri by county.svg 400 × 356; 62 KB
-
COVID-19 Prevalence in Montana by county.svg 400 × 230; 67 KB
-
COVID-19 Prevalence in Nebraska by county.svg 400 × 184; 40 KB
-
COVID-19 Prevalence in Nevada by county.svg 265 × 400; 16 KB
-
COVID-19 Prevalence in New Hampshire by county.svg 208 × 400; 13 KB
-
COVID-19 Prevalence in New Jersey by county.svg 211 × 400; 20 KB
-
COVID-19 Prevalence in New Mexico by county.svg 359 × 400; 26 KB
-
COVID-19 Prevalence in New York by county.svg 400 × 305; 56 KB
-
COVID-19 Prevalence in North Carolina by county.svg 400 × 152; 63 KB
-
COVID-19 Prevalence in North Dakota by county.svg 400 × 238; 30 KB
-
COVID-19 Prevalence in Ohio by county.svg 370 × 400; 52 KB
-
COVID-19 Prevalence in Oklahoma by county.svg 400 × 197; 47 KB
-
COVID-19 Prevalence in Oregon by county.svg 400 × 297; 40 KB
-
COVID-19 Prevalence in Pennsylvania by county.svg 400 × 230; 45 KB
-
COVID-19 Prevalence in Rhode Island by county.svg 256 × 400; 4 KB
-
COVID-19 Prevalence in South Carolina by county.svg 400 × 318; 39 KB
-
COVID-19 Prevalence in South Dakota by county.svg 400 × 248; 34 KB
-
COVID-19 Prevalence in Tennessee by county.svg 400 × 97; 62 KB
-
COVID-19 Prevalence in Texas by county.svg 400 × 380; 160 KB
-
COVID-19 Prevalence in the United States by county.svg 990 × 627; 1.56 MB
-
COVID-19 Prevalence in Utah by county.svg 320 × 400; 28 KB
-
COVID-19 Prevalence in Vermont by county.svg 810 × 810; 17 KB
-
COVID-19 Prevalence in Virginia by county.svg 400 × 173; 87 KB
-
COVID-19 Prevalence in Washington by county.svg 400 × 263; 39 KB
-
COVID-19 Prevalence in West Virginia by county.svg 400 × 355; 36 KB
-
COVID-19 Prevalence in Wisconsin by county.svg 375 × 400; 42 KB
-
COVID-19 Prevalence in Wyoming by county.svg 400 × 314; 19 KB
-
COVID-19 rolling 14day Prevalence in Alabama by county.svg 255 × 400; 51 KB
-
COVID-19 rolling 14day Prevalence in Alaska by county.svg 400 × 227; 136 KB
-
COVID-19 rolling 14day Prevalence in Arizona by county.svg 345 × 400; 20 KB
-
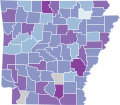
COVID-19 rolling 14day Prevalence in Arkansas by county.svg 400 × 349; 53 KB
-
COVID-19 rolling 14day Prevalence in California by county.svg 338 × 400; 74 KB
-
COVID-19 rolling 14day Prevalence in Colorado by county.svg 400 × 289; 41 KB
-
COVID-19 rolling 14day Prevalence in Connecticut by county.svg 400 × 291; 10 KB
-
COVID-19 rolling 14day Prevalence in Delaware by county.svg 166 × 400; 3 KB
-
COVID-19 rolling 14day Prevalence in District of Columbia by county.svg 322 × 400; 709 bytes
-
COVID-19 rolling 14day Prevalence in Florida by county.svg 400 × 399; 56 KB
-
COVID-19 rolling 14day Prevalence in Georgia by county.svg 347 × 400; 96 KB
-
COVID-19 rolling 14day Prevalence in Hawaii by county.svg 400 × 261; 10 KB
-
COVID-19 rolling 14day Prevalence in Idaho by county.svg 252 × 400; 44 KB
-
COVID-19 rolling 14day Prevalence in Illinois by county.svg 226 × 400; 57 KB
-
COVID-19 rolling 14day Prevalence in Indiana by county.svg 260 × 400; 45 KB
-
COVID-19 rolling 14day Prevalence in Iowa by county.svg 400 × 261; 38 KB
-
COVID-19 rolling 14day Prevalence in Kansas by county.svg 400 × 205; 41 KB
-
COVID-19 rolling 14day Prevalence in Kentucky by county.svg 400 × 169; 76 KB
-
COVID-19 rolling 14day Prevalence in Louisiana by county.svg 400 × 377; 56 KB
-
COVID-19 rolling 14day Prevalence in Maine by county.svg 267 × 400; 27 KB
-
COVID-19 rolling 14day Prevalence in Maryland by county.svg 400 × 210; 22 KB
-
COVID-19 rolling 14day Prevalence in Massachusetts by county.svg 400 × 247; 22 KB
-
COVID-19 rolling 14day Prevalence in Michigan by county.svg 340 × 400; 46 KB
-
COVID-19 rolling 14day Prevalence in Minnesota by county.svg 350 × 400; 50 KB
-
COVID-19 rolling 14day Prevalence in Mississippi by county.svg 246 × 400; 52 KB
-
COVID-19 rolling 14day Prevalence in Missouri by county.svg 400 × 356; 62 KB
-
COVID-19 rolling 14day Prevalence in Montana by county.svg 400 × 230; 67 KB
-
COVID-19 rolling 14day Prevalence in Nebraska by county.svg 400 × 184; 40 KB
-
COVID-19 rolling 14day Prevalence in Nevada by county.svg 265 × 400; 16 KB
-
COVID-19 rolling 14day Prevalence in New Hampshire by county.svg 208 × 400; 13 KB
-
COVID-19 rolling 14day Prevalence in New Jersey by county.svg 211 × 400; 20 KB
-
COVID-19 rolling 14day Prevalence in New Mexico by county.svg 359 × 400; 26 KB
-
COVID-19 rolling 14day Prevalence in New York by county.svg 400 × 305; 56 KB
-
COVID-19 rolling 14day Prevalence in North Carolina by county.svg 400 × 152; 63 KB
-
COVID-19 rolling 14day Prevalence in North Dakota by county.svg 400 × 238; 30 KB
-
COVID-19 rolling 14day Prevalence in Ohio by county.svg 3,675 × 3,995; 154 KB
-
COVID-19 rolling 14day Prevalence in Oklahoma by county.svg 400 × 197; 47 KB
-
COVID-19 rolling 14day Prevalence in Oregon by county.svg 400 × 297; 40 KB
-
COVID-19 rolling 14day Prevalence in Pennsylvania by county.svg 400 × 230; 45 KB
-
COVID-19 rolling 14day Prevalence in Rhode Island by county.svg 256 × 400; 4 KB
-
COVID-19 rolling 14day Prevalence in South Carolina by county.svg 400 × 318; 39 KB
-
COVID-19 rolling 14day Prevalence in South Dakota by county.svg 400 × 248; 34 KB
-
COVID-19 rolling 14day Prevalence in Tennessee by county.svg 400 × 97; 62 KB
-
COVID-19 rolling 14day Prevalence in Texas by county.svg 400 × 380; 160 KB
-
COVID-19 rolling 14day Prevalence in the United States by county.svg 990 × 627; 1.56 MB
-
COVID-19 rolling 14day Prevalence in Utah by county.svg 320 × 400; 28 KB
-
COVID-19 rolling 14day Prevalence in Vermont by county.svg 810 × 810; 17 KB
-
COVID-19 rolling 14day Prevalence in Virginia by county.svg 400 × 173; 87 KB
-
COVID-19 rolling 14day Prevalence in Washington by county.svg 400 × 263; 39 KB
-
COVID-19 rolling 14day Prevalence in West Virginia by county.svg 400 × 355; 36 KB
-
COVID-19 rolling 14day Prevalence in Wisconsin by county.svg 375 × 400; 42 KB
-
COVID-19 rolling 14day Prevalence in Wyoming by county.svg 400 × 314; 19 KB


