Category:Epidemiology of polio
Jump to navigation
Jump to search
Media in category "Epidemiology of polio"
The following 31 files are in this category, out of 31 total.
-
 1916 New York polio epidemic chart.png 538 × 244; 212 KB
-

-

-

-
 Dracunculiasis and Poliomyelitis cases per year.png 827 × 526; 39 KB
-
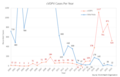 Number of cVDPV cases since 2000.png 718 × 459; 43 KB
-
 Number of poliovirus cases by year, 1975-2015.svg 720 × 540; 22 KB
-
 Number of poliovirus cases by year.png 754 × 547; 38 KB
-
 Number of wild polio and cVDPV cases since 2000 Ar.png 903 × 524; 35 KB
-
 Number of wild polio and cVDPV cases since 2000.png 717 × 521; 48 KB
-
 Number-of-estimated-paralytic-polio-cases-by-world-region (1).png 3,400 × 2,400; 430 KB
-

-

-
 Pediatrics. (1910) (14767432122).jpg 3,616 × 1,980; 693 KB
-
 Polio cases by world region, OWID.svg 850 × 600; 15 KB
-
 Polio vaccine coverage vs Polio cases, OWID.svg 850 × 600; 7 KB
-
 Polio- Rate of cases vs vaccination coverage, OWID.svg 850 × 600; 104 KB
-
 Prevalence of Polio Rates in the United States, 1910-2010, OWID.svg 850 × 600; 15 KB
-

-
 Reported cases of paralytic polio in Nigeria, OWID.png 3,400 × 2,400; 473 KB
-
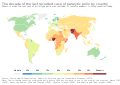
 Reported paralytic polio cases (per 1 million people), OWID.svg 850 × 600; 141 KB
-

-
 Reported-vs-estimated-total-number-of-paralytic-polio-cases-globally (1).png 3,400 × 2,400; 464 KB
-

-
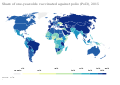 Share of one-year-olds vaccinated against polio (Pol3), OWID.svg 850 × 600; 141 KB
-

-
-
 The number of cases of infectious diseases, OWID.svg 850 × 600; 19 KB
-

-
 The number of reported paralytic polio cases, OWID.svg 850 × 600; 13 KB
-
 Vaccination-introduction-and-cases-or-deaths-scaled.jpg 1,827 × 2,560; 477 KB


.png)
.png)

_(14767432122).jpg)


,_OWID.svg)

.png)

,_OWID.svg)


