Category:Environmental economics
Jump to navigation
Jump to search
English: Environmental economics is the study, using economic modelling, of the environment, including, but not limited to, how best the threat of climate change can be handled.
sub-field of economics | |||||
| Upload media | |||||
| Instance of |
| ||||
|---|---|---|---|---|---|
| Subclass of | |||||
| Different from | |||||
| |||||
Subcategories
This category has the following 15 subcategories, out of 15 total.
Media in category "Environmental economics"
The following 68 files are in this category, out of 68 total.
-
Absolute-relative-entkopplung.svg 575 × 431; 39 KB
-
CCC website logo.jpg 350 × 254; 14 KB
-
Coase-Theorem Szenario 1.png 600 × 600; 21 KB
-
PietroColucci.png 646 × 747; 575 KB
-
Consumption-co2-per-capita-vs-gdppc.svg 850 × 696; 87 KB
-
Cost and exergy for heating energy in Finland.jpg 750 × 475; 32 KB
-
CO₂ emissions per capita vs GDP per capita, OWID.svg 850 × 600; 31 KB
-
Current U.S. and Global Oil,Energy Situation.jpg 600 × 279; 42 KB
-
Diagram of natural resource flows-en.svg 794 × 834; 5 KB
-
Diagram of natural resource flows-ru.svg 737 × 840; 2 KB
-
Diagram of natural resource flows.jpg 538 × 421; 20 KB
-
Ecoproitvision.png 746 × 647; 52 KB
-
EE1c.png 706 × 568; 34 KB
-
Energy-and-economics1.png 980 × 673; 644 KB
-
Environmental-Kuznets-Kurve-deutsch.svg 575 × 431; 40 KB
-
ETS-allowance-prices.svg 720 × 540; 401 KB
-
ExportLandModel-fr.svg 600 × 480; 22 KB
-
FED Logo.jpg 270 × 135; 20 KB
-
Food miles illustration.jpg 2,048 × 1,536; 847 KB
-
Framework SSI2010.gif 451 × 465; 22 KB
-
GDP vs GPI in US.jpg 225 × 260; 18 KB
-
GEIStall.jpeg 640 × 480; 145 KB
-
GTAA - SolarWall.jpg 3,072 × 2,048; 2.84 MB
-
High life expectancy can be achieved with low CO2 emissions-TR.jpg 1,120 × 896; 106 KB
-
High life expectancy can be achieved with low CO2 emissions.jpg 1,120 × 896; 106 KB
-
Highlight Findings of the WA S0E 2007 report.gif 960 × 720; 81 KB
-
Human welfare and ecological footprint sustainability.jpg 850 × 522; 196 KB
-
Human welfare and ecological footprint.jpg 850 × 522; 182 KB
-
Internalisierung externer Effekte.png 1,322 × 767; 138 KB
-
Internalisierung externer Effekte.svg 463 × 376; 13 KB
-
Jari2.JPG 3,425 × 2,256; 484 KB
-
Linwood Pendleton Profile Photo 2.png 125 × 134; 49 KB
-
Linwood Pendleton Profile Photograph.jpg 345 × 500; 194 KB
-
Logo Alpine Convention.jpg 2,349 × 1,197; 191 KB
-
LP Kerhornou.jpg 2,448 × 2,448; 1.37 MB
-
Material-intensity-world-europe.svg 575 × 431; 35 KB
-
Metropolitan Police officers at Critical Mass London, April 2006.jpg 2,304 × 1,728; 846 KB
-
Nachhaltigkeit - Drei-Säulen-Modell und Vorrangmodell.svg 1,191 × 842; 729 KB
-
Nested sustainability-noproprietaryTimesNewRoman-like-font.svg 605 × 416; 9 KB
-
Nested sustainability-v2-fr.svg 640 × 480; 6 KB
-
Nested sustainability-v2.gif 700 × 525; 25 KB
-
Nested sustainability-v2.svg 640 × 480; 6 KB
-
Northeast Solvents (NE Solve) Facility license application, December 31, 1985.jpg 7,835 × 4,373; 5.65 MB
-
Per-capita-co-emissions-vs-human-development-index.svg 850 × 696; 84 KB
-
Pollution- A Negative Externality in Production.png 805 × 515; 103 KB
-
Preventing Real Estate Bubbles.jpg 657 × 679; 100 KB
-
ReedBedSetUps.jpg 1,914 × 2,398; 240 KB
-
Richard Sandor Head Shot.jpg 2,828 × 4,250; 5.16 MB
-
RSEE logo.gif 527 × 524; 12 KB
-
SlashandburninBrazil.jpg 330 × 204; 20 KB
-
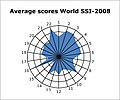
Spider SSI2008.gif 501 × 419; 20 KB
-
Spiderweb 2010.gif 500 × 354; 37 KB
-
Spiderweb SSI2008.jpg 501 × 419; 41 KB
-
Ssi 2010.jpg 483 × 291; 24 KB
-
SSI definition.jpg 341 × 253; 14 KB
-
Système d'échange local.png 601 × 601; 38 KB
-
TragedyofCommons.png 1,039 × 754; 68 KB
-
Transpired Solar Air Collector Operations Schematic.jpg 676 × 506; 86 KB
-
Triple Bottom Line graphic.jpg 1,241 × 877; 237 KB
-
Umweltmanagement Umweltmanagementsystem.png 1,850 × 1,460; 2.68 MB
-
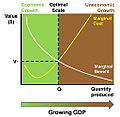
Uneconomic Growth diagram.jpg 1,024 × 996; 56 KB
-
Visualization of monetary costs for broad food categories.webp 1,750 × 816; 34 KB
-
Visualization of percentage price increases for broad food categories.webp 1,750 × 895; 45 KB
-
Visualization of the quantification process for emission values of food.webp 1,350 × 866; 59 KB
-
WaterResourceAllocation.png 952 × 872; 71 KB
-
Zero-Energy Lab Construction.jpg 640 × 480; 52 KB


