Category:English-language SVG charts
Jump to navigation
Jump to search
Subcategories
This category has the following 2 subcategories, out of 2 total.
*
- English-language SVG pie charts (168 F)
B
Media in category "English-language SVG charts"
The following 200 files are in this category, out of 547 total.
(previous page) (next page)-
2005 H-1B admissions by country of citizenship.svg 512 × 366; 10 KB
-
2006-2014 FPS ACT Composite.svg 750 × 510; 11 KB
-
2020 coronavirus cases outside China.svg 659 × 412; 134 KB
-
2020 coronavirus patients in China.svg 988 × 638; 209 KB
-
20210709 Bowling - strikes versus set scores - scatter plot.svg 1,000 × 750; 20 KB
-
A-weighting, ISO 226 and ITU-R 468.svg 512 × 461; 89 KB
-
Abe Cabinet Approval Ratings.svg 659 × 366; 226 KB
-
Absolute configuration.svg 1,280 × 1,280; 14 KB
-
ACRO fatalities.svg 600 × 450; 50 KB
-
ACRO incidents.svg 600 × 450; 53 KB
-
Afghanistan’s ambitious university reform.svg 512 × 308; 907 KB
-
AmdahlsLaw.svg 640 × 500; 4 KB
-
Ancient Roman time keeping hora vigilia equinox solstice.svg 2,647 × 800; 273 KB
-
Ann Arbor Property Crime Statistics, 2004.svg 334 × 224; 200 KB
-
Annual output per employee in Israel, 2000–2010.svg 644 × 398; 1.28 MB
-
Antibiotics action.svg 2,200 × 1,800; 89 KB
-
Arab government expenditure on education as a share of GDP.svg 241 × 398; 983 KB
-
Arabic numerals-en.svg 397 × 142; 39 KB
-
Arkansas-electricity-generation-1990-2012.svg 454 × 255; 258 KB
-
Article.edit diff.lifetime.density.by year.svg 630 × 630; 161 KB
-
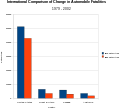
Auto fatalities.svg 530 × 480; 14 KB
-
BERD as a share of GDP in the EU, 2005 and 2013.svg 501 × 357; 2.34 MB
-
Biaroch European GDP per capita 1830-1890.svg 512 × 320; 11 KB
-
Blinder-oaxaca-decomposition-diagram.svg 450 × 309; 203 KB
-
BMI en.svg 940 × 520; 5 KB
-
BMI grid en.svg 940 × 520; 2 KB
-
BMIBoys 1.svg 509 × 704; 88 KB
-
BMIGirls 1.svg 509 × 704; 87 KB
-
Brazilian business sector’s contribution to GERD as a share of GDP, 2012.svg 496 × 333; 1.31 MB
-
Bsa-religion-question-1983-2005.svg 862 × 551; 35 KB
-
Canada specializes in medical sciences.svg 522 × 220; 129 KB
-
Canadian expenditure on energy-related industrial R&D, 2009–2012.svg 482 × 262; 24 KB
-
Canadian IRS number of schools and residences.svg 512 × 317; 16 KB
-
Canon vs nikon number of lenses.svg 894 × 595; 9 KB
-
CBO - Revenues and Outlays as percent GDP.svg 648 × 286; 17 KB
-
Central Asian researchers by field of science, 2013.svg 626 × 366; 1.06 MB
-
Central Asian researchers by sector of employment (HC), 2013.svg 621 × 508; 63 KB
-
Changing composition molten salt reactor-en.svg 512 × 329; 57 KB
-
Chart - Russia for Russians (1998-2011).svg 1,340 × 745; 28 KB
-
Chile GDP per capita (PPP).svg 766 × 473; 23 KB
-
Chile GDP per capita PPP Pinochet.svg 512 × 317; 3 KB
-
Clune2016 food lca.svg 1,000 × 800; 49 KB
-
Cmbr.svg 600 × 480; 18 KB
-
Co-operation partners, low- and middle-income countries.svg 426 × 257; 35 KB
-
Commons Statistics - Megapixels per month.svg 599 × 345; 12 KB
-
Commons Statistics - Size (Kilobytes) per month.svg 599 × 345; 13 KB
-
Comparison between field-effect transistors en.svg 1,000 × 1,000; 102 KB
-
Computer-go-ratings-English.svg 493 × 347; 7 KB
-
Concentration of Bromine vs Time 2.svg 1,000 × 640; 33 KB
-
Concentration of Bromine vs Time.svg 1,000 × 640; 31 KB
-
Concentration profile of sulfate and methane.svg 800 × 600; 44 KB
-
Container-ship-prices.svg 600 × 600; 14 KB
-
Container-ship-rates.svg 600 × 600; 17 KB
-
Copenhagen Bicycle modalshares.svg 642 × 221; 294 KB
-
Copenhagen inner city cycle traffic peak hour.svg 378 × 221; 286 KB
-
Copyright-alerts-chart.svg 567 × 319; 10 KB
-
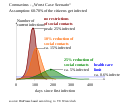
COVID-19 Health care limit.svg 1,249 × 582; 6 KB
-
COVID-19 Variante.svg 1,146 × 980; 6 KB
-
Cyl proj scale 3examples.svg 410 × 270; 46 KB
-
Cyl proj scale Lambert Gall.svg 510 × 290; 55 KB
-
Cyl proj scale merc.svg 500 × 300; 36 KB
-
Cyl proj scale secant.svg 520 × 190; 82 KB
-
Detroit population and rank.svg 500 × 425; 9 KB
-
Divestment growth en.svg 1,200 × 600; 42 KB
-
Doctoral graduates in Canada and other OECD countries, 2012.svg 494 × 330; 104 KB
-
Drug danger and dependence.svg 870 × 417; 13 KB
-
Economic growth in CARICOM countries, 2002–2013.svg 493 × 323; 3.58 MB
-
Economic growth in West Africa, 2005–2013.svg 490 × 344; 1.12 MB
-
Education spending in Israel as a share of GDP, 2002–2011.svg 647 × 313; 207 KB
-
Effect of pH on enzymes.svg 512 × 397; 2 KB
-
Effect of temperature on enzymes.svg 512 × 397; 2 KB
-
Electricity costs for the CARICOM countries, 2011.svg 482 × 326; 2.6 MB
-
Electricity in France fr.svg 600 × 450; 60 KB
-
Electron affinity of the elements.svg 1,050 × 552; 43 KB
-
Emission costs of different transport modes 500 km-en.svg 512 × 278; 5 KB
-
Employment by R&D intensity, 2005 and 2013.svg 500 × 374; 1.75 MB
-
Employment targets to 2020 for Israeli minorities.svg 312 × 458; 1.39 MB
-
EU-GDP-Population.svg 800 × 600; 31 KB
-
FDI inflow to selected Arab economies as a share of GDP, 2006–2013.svg 504 × 371; 623 KB
-
FDI inflows to South Asia as a share of GDP, 2005–2013.svg 517 × 337; 937 KB
-
Figure 8 Family structure of young people aged 18 to 24 years.svg 524 × 448; 586 KB
-
Firms with in-house or external R&D among surveyed countries.svg 496 × 471; 45 KB
-
Firms’ linkages with universities and related institutions.svg 488 × 280; 33 KB
-
First degrees in the UK by classification proportions 1994-95 to 2010-11.svg 1,174 × 655; 27 KB
-
Five states concentrate more than half of Brazilian PhD programmes.svg 418 × 318; 18.46 MB
-
Foreign tourist visited Japan.svg 988 × 518; 72 KB
-
Fossil fuel consumption in Denmark.svg 461 × 319; 63 KB
-
Fossil fuel consumption in Germany.svg 461 × 319; 80 KB
-
Fossil fuel consumption in the United Kingdom.svg 461 × 319; 63 KB
-
Fracture Toughness Thickness Dependence.svg 964 × 619; 11 KB
-
FTE researchers in Brazil by sector, 2001 and 2011.svg 490 × 326; 867 KB
-
Gartner Hype Cycle.svg 559 × 363; 234 KB
-
GDP by economic sector in the CARICOM countries 2012.svg 243 × 357; 2.93 MB
-
GDP growth trends in Central Asia, 2000−2013.svg 644 × 448; 1.62 MB
-
GDP in Central Asia by economic sector, 2005 and 2013.svg 316 × 764; 1.06 MB
-
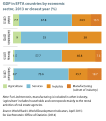
GDP in EFTA countries by economic sector, 2013 or closest year.svg 237 × 269; 1.32 MB
-
GDP per capita and GDP growth rate for Brazil, 2003–2013.svg 497 × 271; 4.67 MB
-
GDP per capita development of Tunisia.svg 850 × 600; 31 KB
-
GDP per capita in Israel, 2009–2013.svg 644 × 407; 1.64 MB
-
GDP per capita in South Asia, 2005–2013.svg 503 × 330; 1.41 MB
-
GDP per economic sector in South Asia, 2013.svg 252 × 384; 1 MB
-
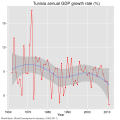
GDP PIB tunisia.svg 630 × 630; 35 KB
-
GDP PPP Russia.svg 1,130 × 590; 6 KB
-
GDPcurrent.svg 630 × 630; 37 KB
-
Genes and base pairs on chromosomes.svg 592 × 298; 32 KB
-
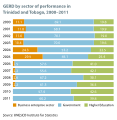
GERD by sector of performance in Trinidad and Tobago, 2000–2012.svg 232 × 237; 3.64 MB
-
GERD GDP ratio for the Black Sea countries, 2001–2013.svg 630 × 486; 1,022 KB
-
GERD GDP ratio in South Asia 2006–2013.svg 495 × 397; 783 KB
-
GERD GDP ratio in Southeast Europe, 2003–2013.svg 494 × 243; 345 KB
-
GERD GDP ratio in the Arab world, 2009 and 2013 or closest years.svg 236 × 681; 1.02 MB
-
GERD GDP ratio in the USA, 2002–2013.svg 482 × 336; 73 KB
-
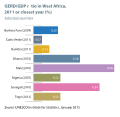
GERD GDP ratio in West Africa, 2011 or closest year.svg 240 × 234; 142 KB
-
GERD in Brazil by funding sector, 2004–2012.svg 496 × 335; 1.31 MB
-
GERD in EFTA countries by type of research, 2012 or nearest year.svg 246 × 221; 1.93 MB
-
GERD in Ghana and Senegal by sector of performance, 2010.svg 240 × 174; 142 KB
-
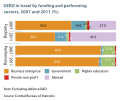
GERD in Israel by funding and performing sectors, 2007 and 2011.svg 313 × 263; 1.25 MB
-
GERD in Southeast Europe by source of funds, 2013.svg 494 × 225; 345 KB
-
GERD in sub-Saharan Africa by field of science, 2012 or closest year.svg 646 × 475; 272 KB
-
GERD in the Black Sea region by sector of performance, 2005 and 2013.svg 630 × 633; 904 KB
-
GERD per capita in Southeast Europe, 2013.svg 494 × 196; 343 KB
-
Global Temperature Anomaly.svg 1,440 × 1,000; 28 KB
-
Goiânia accident - Health outcomes.svg 979 × 598; 28 KB
-
Gold-nominal-constant-usd.svg 2,311 × 1,419; 1.87 MB
-
Government debt to GDP ratio for selected EU countries, 2008–2013.svg 491 × 425; 2.03 MB
-
Grants by the European Research Council, 2013.svg 850 × 601; 42 KB
-
Graph of Milgram-Experiment.svg 512 × 320; 7 KB
-
Gravitational Acceleration Earth-en-mr.svg 512 × 337; 13 KB
-
Gravitational Acceleration Earth-en.svg 512 × 337; 9 KB
-
Growth in Brazilian publications has slowed since 2008.svg 512 × 316; 1.3 MB
-
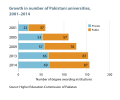
Growth in number of Pakistani universities, 2001–2014.svg 255 × 211; 3.09 MB
-
Growth in scientific output has accelerated in Kazakhstan since 2012.svg 662 × 611; 1.57 MB
-
H1N1 illness onset dates - United States.svg 1,040 × 624; 36 KB
-
Half-age-plus-seven-relationship-rule.svg 755 × 798; 137 KB
-
Harmonic Generation Wiki Fig.svg 512 × 298; 263 KB
-
Heart Rate vs Age.svg 1,467 × 1,022; 26 KB
-
Heating type CH all cantons 2021 EN.svg 990 × 720; 58 KB
-
Heating type CH Canton AG 2021 EN.svg 990 × 720; 12 KB
-
Heating type CH Canton AI 2021 EN.svg 990 × 720; 12 KB
-
Heating type CH Canton AR 2021 EN.svg 990 × 720; 12 KB


