Category:Energy maps of the United States
Jump to navigation
Jump to search
Countries of the Americas: United States of America
Subcategories
This category has the following 3 subcategories, out of 3 total.
I
M
Media in category "Energy maps of the United States"
The following 95 files are in this category, out of 95 total.
-
2013 02 28 Geothermal Capacity-01.jpg 3,300 × 2,550; 793 KB
-
2015 MISO Map.png 1,174 × 985; 304 KB
-
2015-04-17 Geothermal Capacity.jpg 3,301 × 2,551; 967 KB
-
2017 EIA Residential energy price estimates.png 2,000 × 1,237; 305 KB
-
758Syms2006OCSMapWithPlanni.png 758 × 1,002; 129 KB
-
Allegheny Energy service area.svg 600 × 602; 13 KB
-
AtlanticCoastPipeline map.pdf 1,922 × 1,304; 351 KB
-
Average electric percap.png 2,550 × 1,800; 429 KB
-
Average electric prices.png 2,550 × 1,800; 434 KB
-
Average energy percap.png 2,550 × 1,800; 431 KB
-
Average Residential Price of Electricity by State.svg 990 × 627; 304 KB
-
Average Retail Price of Electricity by State.jpg 1,513 × 983; 313 KB
-
Average US Residential Price of Electricity by State fr.svg 990 × 627; 305 KB
-
Average US Residential Price of Electricity by State-2012.svg 990 × 627; 298 KB
-
Carbon per area.png 2,550 × 1,800; 405 KB
-
Carbon per capita.png 2,550 × 1,800; 404 KB
-
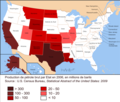
Carte pétrole USA 2006.png 2,500 × 2,116; 850 KB
-
Ccmap 03-19-10---without-request-to-click-at-cities.png 736 × 473; 94 KB
-
Ccmap 12-09-10-without emblem.png 736 × 473; 91 KB
-
Climateregistry map Dec2008.svg 1,720 × 1,780; 270 KB
-
Colonial Pipeline Disruption U.S. East Coast (29877529455).png 485 × 288; 111 KB
-
Colorado, Utah and Wyoming oil shale deposits.jpg 921 × 970; 303 KB
-
Conventional gas production in the United States, 2008.jpg 2,200 × 1,300; 2 MB
-
Diamondpipelinemap.png 502 × 227; 39 KB
-
Electric pct Resid.png 2,550 × 1,800; 422 KB
-
Electric pct Total.png 2,550 × 1,800; 417 KB
-
Electricity price map of the United States 2013.jpeg 5,912 × 4,320; 8.38 MB
-
Fig040.gif 595 × 694; 60 KB
-
Fuel ethanol production by state in 2016 (43142667775).png 572 × 286; 35 KB
-
Gas Price Temperature Map.png 780 × 554; 236 KB
-
Geothermal resource map US.png 503 × 280; 28 KB
-
Heating oil as primary home heating fuel by state in 2021 (52506302054).png 1,099 × 590; 111 KB
-
Map of major renewable energy resource in the contiguous United States.jpg 4,800 × 2,700; 1.64 MB
-
Map US Natural Gas.gif 676 × 446; 47 KB
-
Map-GeothermalPowerUS.jpg 1,400 × 1,175; 130 KB
-
MISO map.JPG 554 × 486; 31 KB
-
Mountian Valley Pipeline.png 580 × 492; 342 KB
-
NIETC-Mid Atlantic corridor US 2007.jpg 1,205 × 927; 491 KB
-
NIETC-Southwest area corridor US 2007.jpg 1,207 × 930; 455 KB
-
Northwest Power and Conservation Council members.svg 959 × 593; 32 KB
-
NPMS Gas Transmission and Hazardous Liquid Pipelines in the United States.jpg 1,056 × 816; 848 KB
-
Nuclear waste locations USA.jpg 1,909 × 1,315; 357 KB
-
Oil and gas pipelines.png 630 × 338; 558 KB
-
Overall Electrification.png 2,550 × 1,800; 417 KB
-
Overall energy price.png 2,550 × 1,800; 429 KB
-
Pacific service magazine (1918) (14760434126).jpg 2,048 × 3,202; 768 KB
-
Renewable Energy by State.jpeg 948 × 684; 101 KB
-
Residential electric percap.png 2,550 × 1,800; 428 KB
-
Residential electric prices.png 2,550 × 1,800; 432 KB
-
Residential Electrification.png 2,550 × 1,800; 422 KB
-
Residential Energy Consumption per Capita.png 2,550 × 1,800; 427 KB
-
Residential Energy Price.png 2,550 × 1,800; 426 KB
-
Screen Shot 2015-12-08 at 7.50.32 PM.png 776 × 596; 541 KB
-
Standardmap.svg 959 × 593; 82 KB
-
State electric generation.png 2,550 × 1,800; 426 KB
-
State electric major renew.png 2,550 × 1,800; 381 KB
-
State electric major.png 2,550 × 1,800; 391 KB
-
State electric salient.png 2,550 × 1,800; 385 KB
-
State energy production.png 2,550 × 1,800; 422 KB
-
State imports.png 2,550 × 1,800; 398 KB
-
State net electric import.png 2,550 × 1,800; 404 KB
-
State net energy import.png 2,550 × 1,800; 392 KB
-
Total oil mean 08 0001.png 2,967 × 2,092; 341 KB
-
Total oil mean 08.svg 3,600 × 2,700; 6.79 MB
-
United States Cooling Degree Day map, 1961-1990.jpg 2,100 × 1,600; 474 KB
-
United States Heating Degree Day map, 1961-1990.jpg 2,100 × 1,600; 644 KB
-
United States installed wind power capacity by state 1999.jpg 664 × 513; 169 KB
-
United States installed wind power capacity by state 2000.jpg 1,100 × 835; 283 KB
-
United States installed wind power capacity by state 2001.jpg 702 × 511; 220 KB
-
United States installed wind power capacity by state 2002.jpg 932 × 674; 365 KB
-
United States installed wind power capacity by state 2003.jpg 800 × 597; 272 KB
-
United States installed wind power capacity by state 2004.jpg 800 × 590; 249 KB
-
United States installed wind power capacity by state 2005.jpg 800 × 600; 264 KB
-
United States installed wind power capacity by state 2006.jpg 959 × 710; 396 KB
-
United States installed wind power capacity by state 2007.jpg 2,985 × 2,190; 2.02 MB
-
United States installed wind power capacity by state 2008.jpg 1,100 × 850; 410 KB
-
United States installed wind power capacity by state 2009.jpg 3,300 × 2,550; 1.82 MB
-
United States Wind Resources and Transmission Lines map.jpg 1,100 × 831; 899 KB
-
UnitedStatesPowerGrid.jpg 1,233 × 808; 262 KB
-
Us coal regions 1996 legend.png 688 × 797; 77 KB
-
Us coal regions 1996.png 1,283 × 798; 48 KB
-
US electric plant capacity map.png 2,550 × 1,800; 1.68 MB
-
US solar break-even cost.png 1,850 × 1,200; 65 KB
-
Utah Oil Shale and Tar Sands Deposits.gif 800 × 618; 68 KB
-
Wind power in the United States.png 1,513 × 983; 63 KB


