Category:Economic maps of Taiwan
Jump to navigation
Jump to search
Subcategories
This category has the following 2 subcategories, out of 2 total.
E
I
Media in category "Economic maps of Taiwan"
The following 14 files are in this category, out of 14 total.
-
 Botanical map of north Formosa 1896.jpg 2,218 × 1,597; 1.67 MB
-
 Four Asian Tigers with flags.svg 410 × 651; 294 KB
-
 Four Asian Tigers.svg 439 × 631; 175 KB
-
 Geological map of north Formosa 1896.jpg 2,211 × 1,612; 1.79 MB
-
 Industrial map of Formosa 1903.jpg 2,200 × 3,100; 2.68 MB
-
 Map intended to show the positions of the coal mines eastward of Kelung 1856.jpg 2,725 × 1,808; 1.99 MB
-
 Map of the southern two-third of Formosa (Taiwan) related to sugar cultivation.tif 3,290 × 5,000; 47.09 MB
-
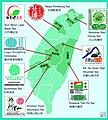
 Shalun Smart Green Energy Science City, Major Developments Map.jpg 975 × 716; 475 KB
-
 Taiwan median income map.svg 1,440 × 1,986; 1.73 MB
-
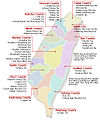 Teaareas taiwansmap.jpg 516 × 620; 111 KB
-
 Unemployment rate of Taiwan.svg 850 × 1,200; 118 KB
-
 चार एशियाई चीते.png 436 × 629; 57 KB
-
 台灣茶葉政府認證標章.jpg 866 × 960; 121 KB
-
 沙崙智慧綠能科學城 武東段276-1地號土地開發案1.png 730 × 432; 165 KB


