Category:Economic maps of Poland
Jump to navigation
Jump to search
Subcategories
This category has the following 4 subcategories, out of 4 total.
E
T
U
Media in category "Economic maps of Poland"
The following 32 files are in this category, out of 32 total.
-
Polen BV042731680.jpg 6,102 × 8,170; 3.67 MB
-
2006Polish exports.PNG 1,425 × 625; 59 KB
-
56 of Longmans' Junior School Geography, etc. (11214144254).jpg 2,704 × 2,001; 1.75 MB
-
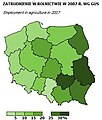
Agricultural employment of Poland by voivodeship, 2007.jpg 293 × 344; 19 KB
-
Dąbrowskie Zagłębie Węglowe - mapa (1918).jpg 800 × 600; 112 KB
-
Industrial Population - DPLA - 0783a34f3314e4feb4a6980d33876807.jpg 10,208 × 12,538; 15.42 MB
-
L'industrie textile en Pologne en 1977. Principaux centres.jpg 1,549 × 1,331; 397 KB
-
Map of LitPol Link.jpg 475 × 330; 59 KB
-
Mapa.big.jpg 10,000 × 7,237; 11.02 MB
-
Pkb.jpg 398 × 461; 22 KB
-
Plony czterech zbóż 1920-2007.png 1,445 × 1,600; 750 KB
-
Plony i zbiory kukurydzy w Polsce.jpg 3,193 × 2,017; 475 KB
-
Poland- Barley per Capita - DPLA - 62a2a14ae479cc546f1549c892e68ec5.jpg 4,832 × 4,068; 2.31 MB
-
Poland- Barley Yield - DPLA - b8d9dcc985ce472c61bc5335d74a6bf5.JPG 4,832 × 4,079; 2.72 MB
-
Poland- Communications - DPLA - d7446f87dbcdc91db45694b6b929dc7c.jpg 10,240 × 12,546; 14.06 MB
-
Poland- Industries - DPLA - 3f1686813aee2adbaa5d50066f6e9a52.jpg 10,240 × 12,544; 14.46 MB
-
Poland- Oats per Capita - DPLA - 67f1a52f369149d25056f9924f8e858e.jpg 6,304 × 5,255; 4.63 MB
-
Poland- Rye per Capita - DPLA - f8181a9ddbf0d2c6d0fcc81de94493fd.jpg 4,864 × 4,156; 3.14 MB
-
Poland- Rye Yield - DPLA - a4e260662611ec79c768e8107575fdc9.jpg 4,832 × 4,087; 2.24 MB
-
Poland- Wheat Yield - DPLA - d62945130022d6fcd98f5197cb49c7d4.jpg 4,800 × 4,085; 2.61 MB
-
Poland-economy.jpg 712 × 1,092; 141 KB
-
Polen BV042517134.jpg 8,706 × 7,552; 5.06 MB
-
Polish voivodeships by gross regional product GRP per capita 2019.png 6,000 × 4,650; 1.31 MB
-
Polish voivodeships by gross regional product GRP per capita.png 5,120 × 3,818; 637 KB
-
Polish voivodeships by GRP (PPS) per capita in 2015.png 5,120 × 3,964; 1.11 MB
-
Polska i swinki.png 884 × 783; 298 KB
-
Polska parki przemysłowe.svg 1,827 × 1,672; 154 KB
-
Srednie place w powiatach.png 1,162 × 1,081; 610 KB
-
Zbiory i plony kukurydzy w Polsce 2016 r. .png 3,193 × 2,017; 1.51 MB
-
Zrzut ekranu 2016-06-01 o 22.03.57.png 683 × 606; 192 KB


