Category:Economic map images that should use vector graphics
Jump to navigation
Jump to search
Images composed of simple shapes, lines, and letters such as those below should be recreated using vector graphics as an SVG file. These have a number of advantages such as making it easier for subsequent editors to edit them, enabling arbitrary scaling at high quality, and sharp high-resolution renderings for print versions. See Commons:Images for cleanup for more information.
This is a subcategory of Category:Images that should use vector graphics. You can add images to this category using the template {{Convert to SVG|economic map}}.
Media in category "Economic map images that should use vector graphics"
The following 200 files are in this category, out of 244 total.
(previous page) (next page)-
2005asparagus.PNG 1,425 × 625; 57 KB
-
2005cinnamon (canella).PNG 1,425 × 625; 57 KB
-
2005cocoa bean.PNG 1,425 × 625; 58 KB
-
2005fig.PNG 1,425 × 625; 59 KB
-
2005hardboard.PNG 1,425 × 625; 61 KB
-
2005ICT.PNG 1,425 × 625; 59 KB
-
2005kiwi fruit.PNG 1,425 × 625; 58 KB
-
2005mushroom and truffle.PNG 1,425 × 625; 58 KB
-
2005onion and shallot.PNG 1,425 × 625; 61 KB
-
2005perlite.PNG 1,425 × 625; 59 KB
-
2005plywood.PNG 1,425 × 625; 58 KB
-
2005soyabean.PNG 1,425 × 625; 58 KB
-
2006Chinese exports.PNG 1,425 × 625; 61 KB
-
2006persimmon.PNG 1,425 × 625; 33 KB
-
2012 11 17 V4 Original.JPG 2,980 × 2,488; 403 KB
-
2012 cocoa bean output.png 1,425 × 625; 51 KB
-
2012apricot.png 1,425 × 625; 71 KB
-
2012lemon and lime.png 1,425 × 625; 72 KB
-
2012pear.png 1,425 × 625; 45 KB
-
2012quince.png 1,425 × 625; 63 KB
-
2012spinach.png 1,425 × 625; 38 KB
-
2013 02 28 Geothermal Capacity-01.jpg 3,300 × 2,550; 793 KB
-
2013chickpea.png 1,425 × 625; 48 KB
-
2013palm oil.png 1,425 × 625; 46 KB
-
2013soybean.png 1,425 × 625; 50 KB
-
A380 12-13.PNG 4,500 × 2,234; 482 KB
-
A380 Airbus-Standorte.png 804 × 1,000; 207 KB
-
ACTA parties.png 1,800 × 820; 107 KB
-
Aer Lingus Dest.png 2,000 × 1,015; 252 KB
-
Affiliation engagement in brand consultation.png 1,152 × 648; 81 KB
-
Afghan Opium Production 2005 2007.JPG 684 × 527; 79 KB
-
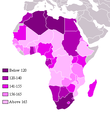
Africa by GDP, 2002.png 360 × 392; 9 KB
-
Africa by HDI, UNDP 2004.png 360 × 392; 13 KB
-
Africa Economia.jpg 1,888 × 2,316; 1.22 MB
-
African Slave Trade.png 1,955 × 890; 329 KB
-
Agriculture characterisation map, Flanders.png 16,211 × 8,225; 1.07 MB
-
Agriculture US South 1860.jpg 802 × 582; 229 KB
-
Aid recipients. $ per capita, 2007.PNG 1,425 × 625; 46 KB
-
Air routes from LHR.PNG 2,096 × 628; 218 KB
-
Airline Allianzen Europa.png 2,000 × 1,503; 381 KB
-
Airports and seaports map.png 1,000 × 1,138; 236 KB
-
Aldi in Europe 2007.PNG 680 × 520; 61 KB
-
Algeria pipelines map.jpg 832 × 799; 203 KB
-
Anbau champagner.png 200 × 224; 22 KB
-
Arabian Sea map piracy.jpg 797 × 753; 157 KB
-
Arable land percent world.png 1,357 × 628; 40 KB
-
Aras Free Economic and Industrial Zone map.jpg 912 × 677; 129 KB
-
Arbeitslosenquote Mecklenburg-Vorpommern.JPG 763 × 594; 62 KB
-
Arbeitslosenquote Mecklenburg-Vorpommern.PNG 763 × 566; 59 KB
-
ArbeitslosigkeitInDeutschland1997.png 920 × 1,336; 340 KB
-
ArbeitslosigkeitInDeutschland1997Lat.PNG 920 × 1,336; 217 KB
-
Arecanutconsum1.PNG 1,425 × 672; 32 KB
-
Asian Financial Crisis EN-2009-05-05.png 570 × 599; 88 KB
-
Atlantic Triangular Trade, 1500-1800s.png 2,199 × 1,806; 847 KB
-
Atlantischer Dreieckshandel.png 1,039 × 737; 154 KB
-
Atlasdelacarne2014 web 140717.png 1,428 × 942; 225 KB
-
Australian wine zones2.png 1,000 × 917; 169 KB
-
Average county property taxes in the United States.jpg 1,024 × 768; 328 KB
-
Average Retail Price of Electricity by State.jpg 1,513 × 983; 313 KB
-
AverageMonthlySalary2019.png 1,025 × 814; 146 KB
-
AWEA proposed 765KV AC super grid for US wind.jpg 1,190 × 766; 119 KB
-
Azeri-Chirag-Guneshli.GIF 439 × 132; 9 KB
-
Big and Little Inch pipelines map.png 1,400 × 1,145; 281 KB
-
BlueberryYield.png 1,600 × 960; 433 KB
-
Bolivia wine and singani regions.png 992 × 1,056; 68 KB
-
Boston income donut.png 626 × 693; 200 KB
-
Brazil - % GDP by Federative Unit.jpg 628 × 815; 230 KB
-
Brent oilfield.jpg 383 × 393; 99 KB
-
British.coalfields.19th.century.jpg 1,088 × 2,017; 358 KB
-
Btc pipeline route.png 482 × 205; 12 KB
-
Burger king world locations.png 1,504 × 707; 56 KB
-
Café importé par pays en 2005(USDA).PNG 1,350 × 625; 40 KB
-
California wine region map en.JPG 503 × 600; 216 KB
-
California wine region map.JPG 503 × 600; 87 KB
-
Canada Exclusive Economic Zone.PNG 2,410 × 1,178; 155 KB
-
Cantvmarkets.png 1,380 × 1,204; 129 KB
-
Carrefour world map (2012).png 2,000 × 883; 273 KB
-
Carte burberry.png 1,357 × 628; 28 KB
-
Carte de typologie agricole, Flandre.png 16,190 × 8,160; 1.11 MB
-
Carte gros plan pays nantais.png 3,898 × 2,953; 632 KB
-
Carte pêche islande.png 800 × 593; 257 KB
-
Centrales nucleares España-de.png 685 × 570; 126 KB
-
China Airports.png 1,590 × 1,125; 958 KB
-
CIA Map of International illegal drug connections.gif 450 × 241; 21 KB
-
CNN News bureaus world.png 1,393 × 628; 40 KB
-
Coffee Imported per Country in 2005(USDA).png 1,350 × 625; 36 KB
-
Comarcas del Patronato de Turismo de Granada.png 529 × 435; 24 KB
-
Comparison between U.S. states and countries by GDP in 2012.jpg 1,513 × 983; 240 KB
-
Concesion Mineras Chontales.jpg 904 × 664; 56 KB
-
Country foreign exchange reserves minus external debt.png 1,818 × 828; 137 KB
-
Cumulative Current Account Balance per capita.png 1,800 × 820; 229 KB
-
Cumulative Current Account Balance.png 1,800 × 820; 239 KB
-
Currencies of World.png 472 × 211; 57 KB
-
Currency-Symbol Regions of the World circa 2006 cropped.png 472 × 211; 56 KB
-
Currency-Symbol Regions of the World circa 2006.png 597 × 420; 102 KB
-
Dams-GAP.jpg 877 × 548; 136 KB
-
Debt.PNG 1,615 × 624; 38 KB
-
Depense-publique-sur-PIB.png 450 × 422; 13 KB
-
Dette publique2011.jpg 2,200 × 1,356; 456 KB
-
Dfnsindust-georgia.jpg 1,006 × 804; 109 KB
-
DisneyLandByCompany.png 1,619 × 1,259; 112 KB
-
DuMont Affiliates 1949.png 882 × 574; 48 KB
-
Early Medieval Economy.jpg 632 × 702; 80 KB
-
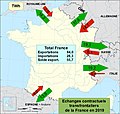
Echg internx élec France.jpg 718 × 682; 150 KB
-
Economic map of metropolitan Detroit.jpg 549 × 455; 29 KB
-
Economic region of Herzegovina.png 1,600 × 1,520; 129 KB
-
Economic Regions of Azerbaijan (2021; labelled).png 970 × 738; 183 KB
-
Economic value of bivalve nutrient extraction.png 1,384 × 1,129; 488 KB
-
Electricity price map of the United States 2013.jpeg 5,912 × 4,320; 8.38 MB
-
Elektrownie w Polsce.JPG 817 × 561; 67 KB
-
Energy Charter Treaty members and observers 2016.png 1,357 × 628; 35 KB
-
Energy per capita.png 800 × 370; 80 KB
-
Enfants au travail dans le monde.png 1,427 × 628; 32 KB
-
EONWestfalenWeser.jpg 410 × 471; 24 KB
-
EPNZ 1-3 oil and gas areas.png 743 × 653; 237 KB
-
Equimap2.jpg 630 × 441; 41 KB
-
EU net budget 2007-2013 per capita cartogram.png 724 × 738; 31 KB
-
Euro outside update 2.PNG 1,244 × 1,244; 92 KB
-
Europe economical bloc.PNG 682 × 209; 9 KB
-
Europe-sud-olive.jpg 807 × 561; 288 KB
-
European union emu map de.png 1,165 × 1,200; 535 KB
-
European Union OCTs Locator.png 2,420 × 1,158; 165 KB
-
EuropeCent.PNG 946 × 786; 391 KB
-
Exclusive economic zone of North Korea.png 427 × 250; 17 KB
-
Exclusive Economic Zones World.png 2,410 × 1,178; 153 KB
-
Fios Availability.jpg 550 × 404; 169 KB
-
Food consumption.gif 1,425 × 625; 26 KB
-
GaspipelinesNachDeutschland.png 1,200 × 1,044; 647 KB
-
Gaz-network-baltic-sea-region.jpg 600 × 500; 164 KB
-
Gdp nominal and ppp 2005 world map single colour.png 1,541 × 1,283; 104 KB
-
GDP nominal per capita world map IMF 2007.PNG 1,350 × 625; 52 KB
-
Generali Group world locations.JPG 1,425 × 625; 69 KB
-
Geo Map of Median Income by Location in Maryland.png 1,208 × 882; 521 KB
-
Georgian Pipelines.gif 438 × 224; 26 KB
-
GINIretouchedcolors.png 1,425 × 625; 47 KB
-
Global Diamond Output in 2005.png 1,425 × 625; 85 KB
-
Global energy consumption.jpg 2,037 × 973; 449 KB
-
Global Gas trade both LNG and Pipeline.png 1,190 × 863; 246 KB
-
GM - Countries by Economic Freedom Index.png 1,800 × 820; 145 KB
-
GM - Countries by Internet Users 2007.png 1,600 × 728; 126 KB
-
Government debt gdp.jpg 1,357 × 628; 335 KB
-
HDP evropa 03 04.gif 789 × 700; 54 KB
-
High Income country.png 1,280 × 592; 127 KB
-
Home Depot.png 982 × 642; 48 KB
-
If US land mass were distributed like US wealth.png 500 × 442; 78 KB
-
IMF Developing Countries Map 2014.png 1,412 × 676; 53 KB
-
Index of Economic Freedom 2009.png 1,350 × 625; 54 KB
-
India Wine.png 1,184 × 1,381; 255 KB
-
Industria mundo.png 1,357 × 628; 113 KB
-
Industry-Iran-map.jpg 1,125 × 1,500; 162 KB
-
Inflation rate world.PNG 1,369 × 628; 42 KB
-
Innovation Group International.png 1,388 × 684; 503 KB
-
Ireland income distribution chart.gif 272 × 273; 23 KB
-
Jimmy John's Locations 2.png 800 × 520; 70 KB
-
Karte Briefzentren Deutsche Post AG.png 1,731 × 2,278; 1.35 MB
-
Karte Länderfinanzausgleich 2004.png 668 × 1,060; 26 KB
-
Karte Länderfinanzausgleich 2012.png 1,022 × 1,326; 230 KB
-
Karte Offshore-Windkraftanlagen in der Deutschen Bucht.png 4,342 × 3,483; 2.61 MB
-
Karte Paketzentren Deutsche Post AG.png 1,705 × 2,233; 1.25 MB
-
Karte Öffentliche Versicherer in Deutschland.png 1,770 × 1,435; 402 KB
-
KarteSteinkohleproduktion.png 1,357 × 628; 25 KB
-
Land of Skåne.png 320 × 311; 5 KB
-
Latin Monetary Union map of 1914.jpg 1,024 × 474; 108 KB
-
Linghai Jixian.png 1,818 × 1,530; 4.16 MB
-
LocationPhantom.png 1,350 × 625; 24 KB
-
Macau Trade Routes.png 1,425 × 625; 58 KB
-
Maize food average per capita.png 1,357 × 628; 31 KB
-
Map of countries by GDP (nominal) in US$.png 1,435 × 625; 48 KB
-
Map of U.S. states by unemployment rate.png 841 × 580; 29 KB
-
Map Vodafone.png 1,200 × 1,001; 285 KB
-
Mapa dos nomes de moedas do mundo.png 1,476 × 742; 49 KB
-
Mapmonde.JPG 1,003 × 561; 57 KB
-
Meat industrie.jpg 1,641 × 1,236; 505 KB
-
Merchant marine by country.PNG 1,363 × 645; 34 KB
-
Mexico StatesHDI 2015.png 1,850 × 1,251; 60 KB
-
Military expenditure by country map.PNG 1,435 × 625; 46 KB
-
Military expenditure by country map2.png 1,435 × 625; 61 KB
-
Military expenditure by GDP 2008.png 1,800 × 820; 148 KB
-
Nandos world map.png 1,885 × 767; 39 KB
-
Niederlassungen-getec-heat-power-2016.png 4,434 × 3,020; 745 KB
-
NileCanals.JPG 704 × 622; 45 KB
-
Nord Pas de Calais mines.png 900 × 360; 14 KB
-
North Bohemian mining limits.jpg 832 × 651; 163 KB
-
Nuclear waste locations USA.jpg 1,909 × 1,315; 357 KB
-
Oil Balance.png 1,800 × 820; 158 KB
-
Oil natural gas infrastructure.png 690 × 532; 77 KB
-
Oil Reserves.png 1,799 × 819; 201 KB
-
Papierproduzenten.png 554 × 254; 39 KB
-
Paramount Television Network.PNG 2,005 × 1,289; 423 KB
-
Parmalat map.png 1,425 × 625; 32 KB
-
PaullHennig.2018.OrganicHectaresMap.jpg 5,000 × 4,500; 889 KB
-
Percent poverty world map.png 1,350 × 657; 21 KB
-
Piggly Wiggly Operations in the US.jpg 659 × 392; 47 KB
-
PIIGSmap.png 1,218 × 1,245; 78 KB
-
Praktiker locations.PNG 1,600 × 1,200; 482 KB
-
Pubdebt.png 299 × 483; 44 KB
-
Ratio dépenses publiques et PIB.png 450 × 475; 21 KB
-
RCEP.jpg 508 × 398; 47 KB
-
Reserves of foreign exchange and gold.PNG 1,800 × 820; 146 KB
-
RF NG pipestoEU.gif 590 × 757; 116 KB


