Category:Economic analysis
Appearance
English: Analysis of economic indicators, identifying how well the economy or a component of it is performing. In organizations: Analyzing benefits and costs, for instance: checking the viability of a project, investment opportunities, or any other matter.
Subcategories
This category has the following 7 subcategories, out of 7 total.
Media in category "Economic analysis"
The following 106 files are in this category, out of 106 total.
-
1 трлн Юкос Yukos 1000000000000 ₽.png 1,548 × 139; 9 KB
-
5 pour cent optimisation.JPG 929 × 555; 45 KB
-
Analysprocess (marknadsmiljö).png 1,786 × 412; 41 KB
-
Analysprocessen.png 1,352 × 192; 16 KB
-
Animated current account surplus and deficit of Eurozone countries since 1999.webm 8.8 s, 960 × 540; 246 KB
-
Boucle comby.svg 512 × 410; 13 KB
-
Boucle transactions prix Paris.jpg 1,201 × 900; 135 KB
-
Bulle 90 variation prix chart.svg 512 × 410; 22 KB
-
CAPRI model Overview.jpg 585 × 398; 31 KB
-
COMERCIO EXTERIOR CUN.pdf 1,275 × 1,650; 4 KB
-
Contango.png 483 × 291; 21 KB
-
CroatianGDP.jpg 1,348 × 948; 193 KB
-
Current account imbalances EN (3D).svg 454 × 602; 379 KB
-
Current account imbalances.png 583 × 539; 80 KB
-
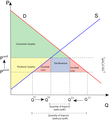
EconomcsCS&PSzh tw.png 1,201 × 901; 166 KB
-
EconomcsGainFromTradeCS&PSzh tw.png 1,201 × 901; 178 KB
-
An Econometric Analysis of Arms Transfer to the ASEAN Countries (IA econometricanaly00poer).pdf 1,191 × 1,556, 184 pages; 5.03 MB
-
Economic analysis chart of movement towards sustainability.jpg 871 × 510; 56 KB
-
Economic health (bars).png 774 × 807; 57 KB
-
Economic health (plain).png 1,174 × 924; 111 KB
-
Economic health.png 1,173 × 940; 145 KB
-
An economic analysis of manpower alternatives for the Navy drug detector dog handler function. (IA economicanalysis00brun).pdf 1,197 × 1,562, 296 pages; 8.77 MB
-
Economic analysis for ADP (IA economicanalysis00gard).pdf 1,375 × 1,825, 82 pages; 3.94 MB
-
Economic analysis of waterfront area services at Naval Station, Long Beach. (IA economicanalysis00hamm).pdf 1,202 × 1,585, 96 pages; 3.76 MB
-
An economic analysis of restructuring undergraduate helicopter flight training (IA economicanalysis00hoef).pdf 1,216 × 1,650, 92 pages; 4.14 MB
-
Economic analysis of Navy ownership vs leasing of vehicles (IA economicanalysis00myer).pdf 1,166 × 1,606, 154 pages; 4.02 MB
-
Economic analysis of redesign alternatives for the RESFMS information system. (IA economicanalysis00rich).pdf 1,175 × 1,566, 172 pages; 7.91 MB
-
An economic analysis of Naval integrated vs. conventional personnel systems. (IA economicanalysis00sapp).pdf 1,170 × 1,562, 160 pages; 4.62 MB
-
Economic analysis of information system (IA economicanalysis00walk).pdf 1,208 × 1,579, 134 pages; 5.1 MB
-
An economic analysis of military expenditures (IA economicanalysis00winn).pdf 1,197 × 1,618, 106 pages; 4.8 MB
-
Economic analysis of vehicle sharing mode for journey to work by Indonesian office employees. (IA economicanalysis00wrek).pdf 1,195 × 1,568, 86 pages; 3.73 MB
-
Economic analysis of post-traumatic stress disorder (PTSD) in the Global War on Terrorism (GWOT) (IA economicnalysiso109453761).pdf 1,275 × 1,650, 220 pages; 799 KB
-
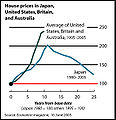
EconomistHomePrices20050615.jpg 581 × 600; 52 KB
-
Eff mash.svg 292 × 456; 24 KB
-
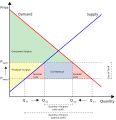
EffectOfTariff.png 516 × 568; 28 KB
-
EffectOfTariff.svg 600 × 620; 7 KB
-
Entwicklung BIP 1960-2004.png 970 × 604; 50 KB
-
Etudiant superieur france.svg 512 × 410; 14 KB
-
Eugenio Filograna.jpg 825 × 1,238; 83 KB
-
Expected path vs. Observed path.jpg 856 × 433; 36 KB
-
FDI in RF.jpg 1,012 × 468; 60 KB
-
FDI of RF 1994-2012.jpg 1,012 × 468; 60 KB
-
Friggit prix trans juillet09.jpg 1,201 × 900; 141 KB
-
Hayek2.svg 684 × 360; 17 KB
-
Historiques transactions F aout09r.jpg 1,201 × 900; 88 KB
-
Historiques transactions Fr.jpg 1,201 × 900; 81 KB
-
How-Simple-Hypothetical-Choice-Experiments-Can-Be-Utilized-to-Learn-Humans-Navigational-Escape-pone.0166908.s007.ogv 31 s, 1,920 × 1,440; 57.29 MB
-
How-Simple-Hypothetical-Choice-Experiments-Can-Be-Utilized-to-Learn-Humans-Navigational-Escape-pone.0166908.s008.ogv 40 s, 1,920 × 1,440; 64.49 MB
-
Indice case shiller october 2011 all.svg 512 × 410; 68 KB
-
Indice case shiller october 2011.svg 512 × 410; 27 KB
-
Indice insee france ensemble.jpg 1,201 × 900; 113 KB
-
Industry of FDI in Russian Federation.jpg 1,012 × 468; 120 KB
-
Knapp-eo-2014.png 1,170 × 300; 666 KB
-
Leistungsbilanzsalden europäischer Länder (1997-2013).svg 745 × 1,006; 285 KB
-
Leistungsbilanzsalden.svg 588 × 505; 108 KB
-
Logement neuf.svg 512 × 410; 11 KB
-
Matrice forces faiblesses.svg 744 × 1,052; 22 KB
-
Matriz de transacciones.JPG 492 × 390; 30 KB
-
Matriz flujo de transacciones.JPG 417 × 527; 38 KB
-
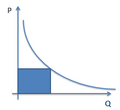
MonopolyPower3-Wiki.JPG 650 × 554; 85 KB
-
Procura.png 247 × 227; 6 KB
-
Prof. Fernando Vianello.jpg 852 × 955; 435 KB
-
Salop.svg 777 × 765; 4 KB
-
Shiller figure mid 2011.svg 512 × 410; 20 KB
-
Shiller indice des prix US.jpg 1,201 × 900; 133 KB
-
Shiller indice des prix US.tif 1,201 × 900; 123 KB
-
Sopostavimiy yroven cen.jpg 753 × 450; 45 KB
-
Sum japan.svg 512 × 410; 23 KB
-
Sum Paris.svg 512 × 410; 16 KB
-
The interrelatedness of the EU market.png 2,000 × 2,000; 1.25 MB
-
Transaction immo dec 2010.svg 512 × 410; 69 KB
-
Transaction immo dec en 2010.svg 512 × 410; 69 KB
-
Tree Map-Atividades Economicas em Aracaju (2012).png 1,540 × 591; 125 KB
-
Tree Map-Atividades Economicas em Boa Vista (2012).png 1,540 × 591; 119 KB
-
Tree Map-Atividades Economicas em Brasilia (2012).png 1,540 × 591; 130 KB
-
Tree Map-Atividades Economicas em Campinas (2012).png 1,540 × 591; 145 KB
-
Tree Map-Atividades Economicas em Campo Grande (2012).png 1,540 × 591; 135 KB
-
Tree Map-Atividades Economicas em Contagem (2012).png 1,540 × 591; 101 KB
-
Tree Map-Atividades Economicas em Cuiaba (2012).png 1,540 × 591; 127 KB
-
Tree Map-Atividades Economicas em Guarulhos (2012).png 1,540 × 591; 113 KB
-
Tree Map-Atividades Economicas em Macapa (2012).png 1,540 × 591; 118 KB
-
Tree Map-Atividades Economicas em Palmas (2012).png 1,540 × 591; 106 KB
-
Tree Map-Atividades Economicas em Porto Velho (2012).png 1,540 × 591; 102 KB
-
Tree Map-Atividades Economicas em Rio Branco (2012).png 1,540 × 591; 121 KB
-
Tree Map-Atividades Economicas em Teresina (2012).png 1,540 × 591; 118 KB
-
Tree Map-Atividades Economicas em Varzea Grande (2012).png 1,356 × 552; 102 KB
-
Tree Map-Exportacoes de Cuiaba (2012).png 1,540 × 632; 67 KB
-
Tunnel friggit aout09.jpg 1,201 × 900; 166 KB
-
Tunnel friggit dec010 en.svg 512 × 410; 18 KB
-
UK cout operation relatif.svg 512 × 410; 13 KB
-
UK indice immobilier deflate.svg 512 × 410; 15 KB
-
UK indice solvabilite.svg 512 × 410; 12 KB
-
Unit labor costs relative to Germany.svg 591 × 559; 103 KB
-
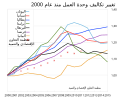
Unit labor costs-ar.svg 434 × 364; 371 KB
-
Unit labor costs.svg 536 × 360; 91 KB
-
Variation case shiller october 2011.svg 512 × 410; 52 KB
-
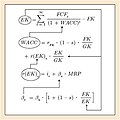
WACC-Ansatz.jpg 327 × 328; 14 KB
-
Western Cape GDP growth 2000-2010.svg 627 × 377; 78 KB
-
Ведущие военные бюджеты мира.png 479 × 287; 5 KB
-
主权违约数量.png 758 × 457; 26 KB
-
外國投資俄羅斯主要項目.jpg 1,012 × 468; 136 KB


