Category:Diagrams of iron and steel industry
Jump to navigation
Jump to search
Subcategories
This category has the following 2 subcategories, out of 2 total.
B
D
Media in category "Diagrams of iron and steel industry"
The following 95 files are in this category, out of 95 total.
-
1950年から1990年までの西側世界ステンレス鋼生産量(粗鋼ベース)の推移.png 811 × 368; 15 KB
-
2001年以降の全世界ステンレス鋼生産量(粗鋼ベース)の推移.png 812 × 366; 23 KB
-
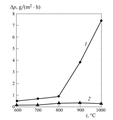
Aluminized Steel Oxidation over TIme.png 302 × 320; 25 KB
-
Balken.jpg 1,223 × 448; 39 KB
-
CEN recycling steel.svg 441 × 182; 2 KB
-
Cercado.jpg 1,046 × 512; 26 KB
-
Coefficient dilatation lineique aciers.svg 513 × 399; 63 KB
-
Continuous casting quality areas.svg 372 × 622; 17 KB
-
Continuous casting types.svg 848 × 455; 29 KB
-
Cooling01.jpg 653 × 600; 55 KB
-
Copper-sxew-greek.png 2,200 × 1,700; 57 KB
-
Cost iron steel rails US GB.svg 2,306 × 992; 45 KB
-
Cu-zn-fes2-flotation-greek.png 2,200 × 1,699; 76 KB
-
Denomination alliages fer teneur c.svg 432 × 128; 27 KB
-
Designation aciers EN10027 1 2.svg 1,028 × 580; 9 KB
-
Diagramme potentiel pH du fer.PNG 1,725 × 1,202; 23 KB
-
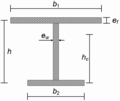
DoubleT-section.png 591 × 498; 3 KB
-
Drawing of modillion.gif 328 × 246; 13 KB
-
Effectifs sidérurgie mines de fer Lorraine Luxembourg.svg 1,743 × 1,211; 34 KB
-
Effectifs sidérurgie mines de fer Lorraine.svg 1,743 × 1,211; 30 KB
-
Elaboration-acier.png 694 × 733; 13 KB
-
ESR1 uddeholm.jpg 1,575 × 1,208; 344 KB
-
Evolution convertisseurs complet.svg 1,079 × 669; 42 KB
-
Evolution convertisseurs.svg 976 × 643; 20 KB
-
Evolution minerai fer.svg 1,534 × 1,273; 45 KB
-
Evolution production acier pays.svg 1,733 × 1,128; 42 KB
-
Ferroalloys production evolution.svg 1,502 × 1,172; 28 KB
-
Ferromanganese production evolution.svg 1,246 × 1,372; 28 KB
-
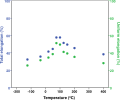
Fe–15Mn–3Al–3Si Tensile properties - 1.png 629 × 504; 30 KB
-
Fe–15Mn–3Al–3Si Tensile properties - 1.svg 529 × 440; 43 KB
-
Fe–15Mn–3Al–3Si Tensile properties - 2.png 629 × 504; 31 KB
-
Fe–15Mn–3Al–3Si Tensile properties - 2.svg 529 × 440; 46 KB
-
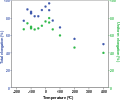
Fe–55Mn–3Al–3Si Tensile properties - 1.png 629 × 504; 27 KB
-
Fe–55Mn–3Al–3Si Tensile properties - 1.svg 529 × 440; 50 KB
-
Fe–55Mn–3Al–3Si Tensile properties - 2-2.svg 744 × 525; 9 KB
-
Fe–55Mn–3Al–3Si Tensile properties - 2.png 629 × 504; 27 KB
-
Fe–55Mn–3Al–3Si Tensile properties - 2.svg 529 × 440; 51 KB
-
FilieresAcierCoulé.svg 719 × 636; 33 KB
-
Finex.png 6,144 × 4,248; 2.16 MB
-
Four siemens schema.png 510 × 430; 7 KB
-
Gen Arcelor2006.gif 865 × 1,260; 122 KB
-
Grate-kiln flöde.jpg 813 × 256; 34 KB
-
HIsarna.png 5,600 × 4,056; 1.52 MB
-
Hot blast.jpg 218 × 386; 13 KB
-
Iron-steel-production-greek.png 2,041 × 1,540; 88 KB
-
ITmk3 Process diagram.svg 2,385 × 1,331; 174 KB
-
Jarosit-Laugung.JPG 640 × 933; 50 KB
-
Krupp-Renn Process diagram.svg 716 × 412; 56 KB
-
Ladle refining uddeholm.jpg 1,575 × 1,125; 296 KB
-
Low carbon steel and Aluminium Stress vs. Strain curve E.png 840 × 840; 66 KB
-
Material s.PNG 315 × 185; 23 KB
-
Melt Down uddeholm.jpg 1,575 × 1,125; 365 KB
-
Midrex Process diagram.svg 557 × 396; 91 KB
-
New Jersey Zinc Vertical Retort Process (US Pat 2457552) -de.svg 910 × 980; 105 KB
-
New Jersey Zinc Vertical Retort Process (US Pat 2457552).svg 910 × 980; 106 KB
-
New-Jersey-Verfahren.jpg 697 × 776; 131 KB
-
Open hearth furnace size evolution sketch.svg 954 × 897; 33 KB
-
Outline of steel heat treatment.jpg 1,301 × 754; 64 KB
-
PigironSteel.jpg 291 × 235; 52 KB
-
Powder metallurgy process uddeholm.JPG 3,150 × 1,663; 794 KB
-
Prix acier fonte US.svg 949 × 890; 25 KB
-
Procédés de réduction directe par tambour rotatif.svg 303 × 173; 59 KB
-
Production fonte au bois France Allemagne G-B US mid range.svg 1,179 × 2,151; 35 KB
-
Production fonte au bois France Allemagne G-B US.svg 1,176 × 647; 32 KB
-
Production fonte au bois France Allemagne G-B.svg 1,176 × 647; 30 KB
-
Production fonte fer acier France G-B.svg 1,225 × 788; 28 KB
-
Production préréduits (DRI et HBI) par procédés Midrex HYL Charbon.svg 1,627 × 1,220; 32 KB
-
PSM V40 D030 Plan of the experimental steel works at wyandotte.jpg 2,704 × 1,801; 395 KB
-
Recovery01.jpg 750 × 391; 53 KB
-
Reve02.svg 774 × 574; 61 KB
-
Sidérurgie Circuit Fer 2012 es.svg 722 × 483; 50 KB
-
Sidérurgie Circuit Fer 2012.svg 722 × 469; 48 KB
-
StabilityKip.svg 512 × 384; 4 KB
-
Stahlerzeugung.png 743 × 470; 60 KB
-
Stahlproduzenten Weltkarte.png 554 × 254; 38 KB
-
Steel production and GPD per capita.svg 2,026 × 1,248; 39 KB
-
Steel production by country map.PNG 1,445 × 633; 41 KB
-
Steel-processing-greek.png 960 × 720; 54 KB
-
TATA-Dyesol DSC on Steel.gif 1,308 × 602; 100 KB
-
Thermal Treated.jpg 514 × 282; 14 KB
-
Thermal Untreated.jpg 485 × 251; 18 KB
-
Transformations allotropiques fer.svg 180 × 545; 63 KB
-
Transperant Tandem DSC on Glass.gif 839 × 549; 52 KB
-
UK Cast Iron Production 1720-1806, by fuel type.svg 1,200 × 870; 187 KB
-
UNP.png 224 × 595; 1 KB
-
Uphill Casting uddeholm.jpg 100 × 73; 7 KB
-
Uregek02.jpg 768 × 227; 45 KB
-
US Steelmaking Process Percentages 1950-2012.png 2,945 × 2,107; 217 KB
-
Wirbelschichtofen.JPG 640 × 450; 23 KB
-
World steel production.png 3,508 × 2,480; 52 KB
-
World-steel-stats-german-1943-2012.png 1,495 × 903; 51 KB
-
World-steel-stats-greece-1943-2012.png 1,920 × 1,055; 25 KB
-
Zetownik.png 1,182 × 1,086; 20 KB
-
主要国別ステンレス鋼生産量の推移.png 912 × 479; 42 KB


