Category:Diagrams of New York City
Jump to navigation
Jump to search
- 100 most populous cities of the United States
- 1–25
- Chicago
- Indianapolis
- New York City
- 26–50
- Las Vegas
- 51–75
- 76–100
Subcategories
This category has the following 5 subcategories, out of 5 total.
N
W
Media in category "Diagrams of New York City"
The following 14 files are in this category, out of 14 total.
-
2020 New York City Property Tax ($ in millions).png 600 × 371; 26 KB
-
206. New York Subway - Converter Floor Plan of Sub-station No. 14.jpg 1,115 × 3,034; 733 KB
-
208. New York Subway - Longitudinal Section of Sub-station No. 14.jpg 2,572 × 1,684; 721 KB
-
Clearview Interchange Diagram, Bayside, Queens, New York.jpg 2,487 × 1,865; 660 KB
-
Cross Island Pkwy – I-495 Interchange Diagram, Douglaston, Queens, NY.jpg 2,487 × 1,858; 1.13 MB
-
Grand Central Terminal - Upper Level Diagram 1939.jpg 914 × 1,074; 252 KB
-
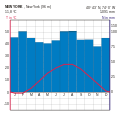
Klimadiagr New york.svg 1,063 × 1,063; 152 KB
-
New York City Property Tax as a percent of Expenditures.png 1,048 × 646; 25 KB
-
New York City Property Tax Revenue ($ in millions).png 1,146 × 859; 55 KB
-
New York Murders Annually - 1928-2023.svg 1,984 × 1,182; 35 KB
-
NUKEMAP screenshot.png 2,304 × 1,591; 2.49 MB
-
Nyc property tax history.png 1,135 × 701; 49 KB
-
NYC Subway animation vc.webm 4 min 21 s, 554 × 720; 79.2 MB
-
Railway map around New York City.png 512 × 384; 16 KB


