Category:Demographics of Aomori prefecture
Jump to navigation
Jump to search

Subcategories
This category has only the following subcategory.
Media in category "Demographics of Aomori prefecture"
The following 12 files are in this category, out of 12 total.
-
 09aomoripopulation e-e.png 1,223 × 1,101; 337 KB
-
 09年青森県の人口の推移.png 1,731 × 1,105; 127 KB
-
-
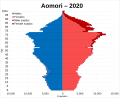 Aomori prefecture population pyramid in 2020.svg 2,695 × 2,197; 33 KB
-
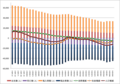
 Change of young adlt and older stage population Aomori 1920-2035.jpg 720 × 540; 83 KB
-
 Demographic movement Aomori 2009.png 1,201 × 844; 234 KB
-

-
 Growth rate map of municipalities of Aomori prefecture, Japan.svg 800 × 842; 24 KB
-
 Labor power of Aomori prefecture.png 1,637 × 947; 358 KB
-
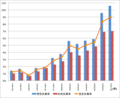
 Number of marriage and divorce in Aomori prefecture 1935-2011.png 1,806 × 1,199; 107 KB
-
 Total unemployment ratio Aomori prefecture1950-2010.png 1,149 × 937; 86 KB
-
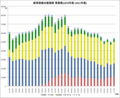
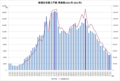 新規住宅着工戸数 青森県 1951-2011.png 1,894 × 1,274; 191 KB


