Category:De Bruijn graphs
Jump to navigation
Jump to search
node-link graph representing overlaps between sequences of symbols | |||||
| Upload media | |||||
| Instance of | |||||
|---|---|---|---|---|---|
| Subclass of | |||||
| Named after | |||||
| |||||
Media in category "De Bruijn graphs"
The following 30 files are in this category, out of 30 total.
-
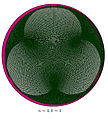
2-2-4-4-de-Bruijn-torus.svg 707 × 682; 35 KB
-
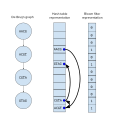
Comparing de brujin graph in memory.png 691 × 682; 34 KB
-
Comparing de brujin graph in memory.svg 512 × 506; 73 KB
-
De Bruijin digraph.png 229 × 415; 6 KB
-
De Bruijn binary graph.svg 512 × 384; 4 KB
-
De Bruijn digraph 2 3.png 229 × 415; 10 KB
-
De bruijn graph-for binary sequence of order 4.svg 320 × 448; 17 KB
-
De Bruijn sequence 10 4.svg 512 × 658; 403 KB
-
De Bruijn-graph 4-3.jpg 406 × 435; 193 KB
-
De Bruijn-graph 4-4.jpg 395 × 437; 198 KB
-
De Bruijn-graph 5-3.jpg 402 × 441; 200 KB
-
De Bruijn-graphs 2.jpg 655 × 384; 213 KB
-
De Bruijn-graphs 3.jpg 620 × 353; 221 KB
-
DeBruijn-3-2.svg 792 × 414; 5 KB
-
DeBruijn-as-line-digraph.svg 954 × 648; 30 KB
-
Debruijngraph.gif 447 × 577; 4 KB
-
DeBruijnGraph24.svg 420 × 540; 39 KB
-
Decomposition of a de Bruijn graph of MetaVelvet.pdf 1,039 × 1,081; 95 KB
-
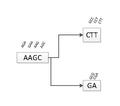
DNA flow chart.png 1,760 × 1,360; 56 KB
-
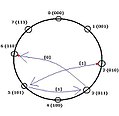
Figura1koorde.jpg 400 × 387; 19 KB
-
Final DNA flow chart.png 1,760 × 1,360; 17 KB
-
Final Sample DNA flow chart.png 710 × 240; 18 KB
-
MeteVelvetSampleNode.pdf 506 × 447; 82 KB
-
Sample DNA flow chart.png 1,200 × 600; 104 KB
-
Simple de Bruijn Graph.png 880 × 320; 8 KB
-
Simple DNA flow chart - New Page.png 1,200 × 600; 48 KB
-
Simplified DNA flow chart.png 1,760 × 1,360; 42 KB
-
Simplified Sample DNA flow chart.png 1,200 × 600; 72 KB
-
Visualisation of a (256,256;4,4) 2 de Bruijn torus.png 256 × 256; 1 KB
-
Visualisation of a (256,256;4,4) 2 de Bruijn torus.svg 1,560 × 1,560; 139 KB


