Category:Cycling related charts and diagrams
Jump to navigation
Jump to search
Subcategories
This category has the following 2 subcategories, out of 2 total.
C
M
Media in category "Cycling related charts and diagrams"
The following 17 files are in this category, out of 17 total.
-
A Short History of Traffic Engineering.jpg 3,859 × 4,209; 1.03 MB
-
A Short History of Traffic Engineering.png 2,480 × 3,508; 252 KB
-
Allocation of Space for Transport Infrastructure - Example of Berlin.png 4,267 × 4,268; 343 KB
-
Car-free Day. September 22 (29360790024).jpg 1,610 × 1,610; 695 KB
-
Carbon footprint scale of transportation means icon.png 4,327 × 1,635; 215 KB
-
Clean mobility instead of dirty traffic.jpg 2,067 × 1,800; 302 KB
-
Corridor Capacity and Infrastructure Costs de.svg 1,324 × 1,329; 4.95 MB
-
Corridor Capacity and Infrastructure Costs.png 4,141 × 4,159; 818 KB
-
Corridor Capacity.png 4,329 × 2,800; 189 KB
-
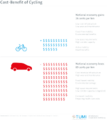
Cost-Benefit of Cycling.png 3,718 × 4,158; 290 KB
-
EffizienzLeistungFahrzeuge.png 1,198 × 855; 80 KB
-
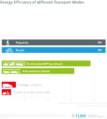
Energy Efficiency of different Transport Modes.png 3,724 × 4,159; 250 KB
-
Passenger Capacity of different Transport Modes.png 3,722 × 4,159; 457 KB
-
RenaissanceDuVelo.png 689 × 400; 171 KB
-
Road Space Requirements.png 3,717 × 4,182; 308 KB
-
STOPLightSignGraph.png 605 × 340; 65 KB


