Category:Consumption maps of the world
Jump to navigation
Jump to search
Subcategories
This category has the following 2 subcategories, out of 2 total.
A
B
Media in category "Consumption maps of the world"
The following 55 files are in this category, out of 55 total.
-
-
 Atlasdelacarne2014 web 140717.png 1,428 × 942; 225 KB
-
 Atlasdelacarne2014 web 140718.png 1,408 × 928; 225 KB
-
 Average per capita alcohol consumption in 15-19 year olds, OWID.svg 850 × 600; 141 KB
-
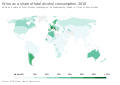
 Beer as a share of total alcohol consumption, OWID.svg 850 × 600; 139 KB
-
 Beer consumption per person, OWID.svg 850 × 600; 141 KB
-
 CigaretteConsumptionPerCapita.svg 2,560 × 1,134; 1.18 MB
-
 Coal consumption, OWID.svg 850 × 600; 141 KB
-
 Coffee consumption map-en.svg 940 × 477; 2.41 MB
-
 Colakonsumtion 2002.png 1,357 × 628; 20 KB
-
 Consumption of Ozone-Depleting Substances, OWID.svg 850 × 600; 140 KB
-
 Consumption-based CO₂ emissions per capita, OWID.svg 850 × 600; 140 KB
-
 Consumption-based CO₂ emissions, OWID.svg 850 × 600; 141 KB
-
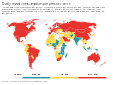 Daily meat consumption per person, OWID.svg 850 × 600; 139 KB
-
 Daily meat consumption per person.svg 850 × 600; 152 KB
-
 Daily per capita fat supply, OWID.svg 850 × 600; 141 KB
-
 Domestic-material-consumption-per-capita (OWID 0280).png 850 × 600; 108 KB
-
 Domestic-material-consumption-per-capita,2017.png 3,400 × 2,400; 730 KB
-
 Electricity consumption per country map.PNG 1,459 × 638; 39 KB
-
 Energy use per person.svg 850 × 600; 169 KB
-
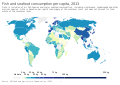 Fish and seafood consumption per capita, OWID.svg 850 × 600; 141 KB
-
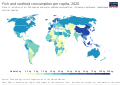 Fish-and-seafood-consumption-per-capita-map.svg 850 × 600; 166 KB
-
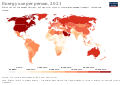
 Fossil Fuel Consumption, 2021.png 1,456 × 1,018; 294 KB
-
 Fruit consumption per capita, OWID.svg 850 × 600; 140 KB
-
 Meat supply per person, OWID.svg 850 × 600; 141 KB
-
 Meat Supply per Person.svg 850 × 600; 164 KB
-
 National Ecological Footprint of Consumption Compared to Total Biocapacity.jpg 2,200 × 1,700; 278 KB
-
 National mean intake of milk (A), cheese (B), and yoghurt (C) in 2018, all ages.jpg 4,175 × 5,806; 2.3 MB
-
 National mean intake of seafood (A) and egg (B) in 2018, all ages.jpg 4,176 × 3,774; 1.52 MB
-

-
 Oil consumption, OWID.svg 850 × 600; 141 KB
-
 Palm-oil-imports (OWID 0681).png 850 × 600; 92 KB
-
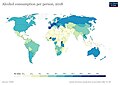
 Per capita alcohol consumption, kilograms per year, OWID.svg 850 × 600; 141 KB
-
 Per capita egg consumption, OWID.svg 850 × 600; 141 KB
-
 Per capita milk consumption, OWID.svg 850 × 600; 140 KB
-
 Per-capita-egg-consumption-kilograms-per-year.png 3,400 × 2,400; 806 KB
-
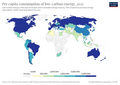 Per-capita-low-carbon-energy (OWID 0756).png 850 × 600; 108 KB
-
 Per-capita-milk-consumption.png 3,400 × 2,400; 815 KB
-
 Prevalence-of-tobacco-use-sdgs.png 3,400 × 2,400; 739 KB
-
 Primary-energy-renewables (OWID 0907).png 850 × 600; 126 KB
-
 Rice consumption.png 1,080 × 561; 272 KB
-
 Seafood consumption.png 1,080 × 575; 305 KB
-
 Share of adults who drank alcohol in last year, OWID.svg 850 × 600; 141 KB
-
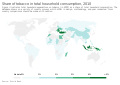 Share of tobacco in total household consumption, OWID.svg 850 × 600; 139 KB
-
 Share-of-households-consuming-iodized-salt.png 3,400 × 2,400; 787 KB
-
 Spirits as a share of total alcohol consumption, OWID.svg 850 × 600; 141 KB
-
 Spirits consumption per person, OWID.svg 850 × 600; 140 KB
-
 Teacon1.png 696 × 372; 128 KB
-
 Total-alcohol-consumption-per-capita-litres-of-pure-alcohol.jpg 3,400 × 2,400; 249 KB
-
 Vegetable consumption per capita 2017, OWID.svg 850 × 600; 162 KB
-
 Wine as a share of total alcohol consumption, OWID.svg 850 × 600; 140 KB
-
 Wine consumption per person, OWID.svg 850 × 600; 141 KB
-
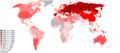 World map of countries by number of cigarettes smoked per adult per year.png 3,760 × 1,660; 693 KB
-
 World map of countries by number of cigarettes smoked per adult per year.svg 940 × 415; 1.62 MB
-


.png)


,_cheese_(B),_and_yoghurt_(C)_in_2018,_all_ages.jpg)
_and_egg_(B)_in_2018,_all_ages.jpg)
_and_processed_meat_(B)_in_2018,_all_ages.jpg)

.png)


.png)


.png)


