Category:Climate maps of the United States
Jump to navigation
Jump to search
Climate maps, including long-term precipitation and temperature averages, of the United States. See also Category:Weather maps of the United States.
Subcategories
This category has the following 4 subcategories, out of 4 total.
K
T
Media in category "Climate maps of the United States"
The following 121 files are in this category, out of 121 total.
-
Climateregistry map Dec2008.svg 1,720 × 1,780; 270 KB
-
138 of 'Elementary Physical Geography' (11300394963).jpg 1,397 × 980; 323 KB
-
166 of 'Elementary Physical Geography' (11300119376).jpg 1,360 × 1,008; 263 KB
-
173 of 'Elementary Physical Geography' (11301377436).jpg 1,412 × 883; 263 KB
-
1893 Arid regions of the western united states.jpg 556 × 450; 92 KB
-
1900- Temperature change in the United States (color-coded map).png 928 × 910; 74 KB
-
1991 halloween low track.jpg 473 × 662; 57 KB
-
313 of 'Eclectic Physical Geography' (11200815444).jpg 2,066 × 1,296; 801 KB
-
315 of 'Eclectic Physical Geography' (11200538114).jpg 2,066 × 1,312; 769 KB
-
743 of 'The International Geography. ... Edited by H. R. Mill' (11250350166).jpg 2,288 × 1,400; 1.02 MB
-
Absolute Humidity for July 1876-1886 Map.jpg 3,489 × 2,930; 2.24 MB
-
Annual report of the Secretary of the Board of Agriculture" (1854-1915) (18744761064).jpg 2,958 × 2,009; 1.04 MB
-
April 16, 2002 SPC High Risk.png 720 × 540; 22 KB
-
April 6, 2003 SPC High Risk.png 448 × 358; 10 KB
-
Average Annual High Temperature of the United States.jpg 1,725 × 1,100; 318 KB
-
Average Date of First Killing Frost.jpg 2,955 × 2,195; 1.65 MB
-
Average Date of Last Killing Frost.jpg 2,958 × 2,264; 1.74 MB
-
Average precipitation in Michigan.png 1,166 × 890; 305 KB
-
Average precipitation in the lower 48 states of the USA.png 2,785 × 1,873; 2.19 MB
-
Average Temps in Southwest (14298342612).png 1,082 × 1,220; 297 KB
-
Bermudahoch Hurrikan.jpg 2,481 × 1,634; 882 KB
-
Boston Winter Snowfall Counts Distribution-revised.png 7,534 × 5,450; 1.09 MB
-
CAprecipitation.png 589 × 450; 48 KB
-
Ccmap 03-19-10---without-request-to-click-at-cities.png 736 × 473; 94 KB
-
CDC Example Graphic.gif 540 × 502; 51 KB
-
Climat des Grands-Lacs.png 959 × 761; 315 KB
-
Climate map USA.PNG 680 × 455; 42 KB
-
Climate Panorama United States.png 1,143 × 649; 70 KB
-
Climatemapusa.JPG 701 × 565; 63 KB
-
Climatemapusa2.PNG 701 × 565; 44 KB
-
Coastal currents along the Atlantic coast of the United States (1942) (20035163774).jpg 3,634 × 1,586; 800 KB
-
Coastal currents along the Atlantic coast of the United States (1942) (20035207064).jpg 4,056 × 1,882; 984 KB
-
Coastal currents along the Atlantic coast of the United States (1942) (20035219664).jpg 2,862 × 1,532; 563 KB
-
Coastal currents along the Atlantic coast of the United States (1942) (20036909893).jpg 2,960 × 1,550; 682 KB
-
Coastal currents along the Atlantic coast of the United States (1942) (20469786660).jpg 3,810 × 1,802; 780 KB
-
Coastal currents along the Atlantic coast of the United States (1942) (20469786728).jpg 3,640 × 1,602; 783 KB
-
Coastal currents along the Atlantic coast of the United States (1942) (20470999019).jpg 3,634 × 1,636; 828 KB
-
Coastal currents along the Atlantic coast of the United States (1942) (20664463331).jpg 3,548 × 1,678; 689 KB
-
Coteau des prairies.jpg 311 × 300; 13 KB
-
DroughtMonitor 20140211.png 1,163 × 898; 504 KB
-
Dry-farming; (1911) (20489161513).jpg 2,880 × 1,974; 1.73 MB
-
EB9 United States - rainfall chart.jpg 2,426 × 1,713; 1.12 MB
-
EB9 United States - temperature chart.jpg 2,414 × 1,705; 2.01 MB
-
Elementary physical geography (1907) (14585290739).jpg 2,384 × 1,630; 602 KB
-
Elementary physical geography (1907) (14768768791).jpg 2,416 × 1,648; 568 KB
-
Elementary physical geography (1907) (14768787871).jpg 2,400 × 1,624; 788 KB
-
Elementary physical geography (1907) (14771939255).jpg 2,432 × 1,648; 576 KB
-
February 1936 US Temperature.gif 667 × 462; 417 KB
-
FrostBeltUSAMap.png 640 × 396; 46 KB
-
GAprecipitation.gif 519 × 378; 42 KB
-
Great Lakes Snowbelt EPA fr.png 1,867 × 1,485; 3.63 MB
-
Hudson Branch at Ellicott City water level - May 2018 flood.png 600 × 465; 17 KB
-
July diurnalvariation US.svg 765 × 549; 14.95 MB
-
Karte klimastat.svg 1,063 × 1,063; 263 KB
-
Koppen-Geiger Map USA present.svg 1,816 × 850; 10.26 MB
-
Little Patuxent River at Allview - May 2018 flood.png 600 × 465; 17 KB
-
Map showing rainfall areas of Colorado - DPLA - 0c69eefb58834cc3ad3b53a204858684.jpg 10,008 × 7,680; 12.23 MB
-
Max Air Temperature F for US County from 1979-2011.png 1,567 × 864; 200 KB
-
Maximum temperature map of the United States.jpg 3,495 × 2,938; 2.16 MB
-
Minimum temperature map of the United States.jpg 3,477 × 2,936; 2.1 MB
-
Mississippi Flood 1993.PNG 420 × 295; 18 KB
-
NDFD-sample-max-temp.png 515 × 424; 47 KB
-
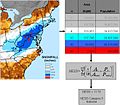
NESIS description NCDC.jpg 660 × 578; 59 KB
-
NIE 1903 Frost - First Frost in Autumn.jpg 2,506 × 1,583; 1.85 MB
-
NIE 1903 Frost - Last Frost in Spring.jpg 2,509 × 1,587; 1.63 MB
-
NIE 1905 Humidity - Average Annual Relative Humidity in the U.S.jpg 2,480 × 1,560; 1.66 MB
-
NOAA-CPC-drought-monitor-sample.gif 540 × 417; 67 KB
-
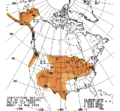
NOAA-CPC-seasonal-temp-outlook.gif 719 × 668; 27 KB
-
North Carolina Climate Map.PNG 531 × 201; 16 KB
-
NYrainfall.png 588 × 400; 150 KB
-
Patapsco River at Ellicott City - May 2018 flood.png 600 × 465; 17 KB
-
Precipitation of Kentucky.png 2,122 × 1,640; 479 KB
-
Precipitation of Oklahoma.gif 589 × 450; 49 KB
-
Probability of a white Christmas in the United States 1981-2010.jpg 1,022 × 786; 281 KB
-
Probability of a white Christmas in the United States.gif 650 × 300; 61 KB
-
Rate of Change in US (14299707854).png 1,158 × 1,401; 465 KB
-
SantaAnaWinds QuikSCAT 2002feb.jpg 540 × 377; 92 KB
-
SCprecipitation.gif 561 × 377; 38 KB
-
Snow-removal-cleveland-3.jpg 478 × 601; 109 KB
-
Snowbeltus.PNG 841 × 580; 27 KB
-
Southern California Precipitations.gif 960 × 745; 32 KB
-
Summer 1936 US Precipitation.gif 661 × 462; 413 KB
-
Summer 1936 US Temperature.gif 667 × 462; 417 KB
-
TCstaterainfall.gif 2,003 × 1,324; 113 KB
-
Temp Outlook 6-10day 081207.gif 719 × 668; 25 KB
-
Temperatures juillet usa.PNG 731 × 489; 491 KB
-
Températuresjanvier1.PNG 731 × 489; 491 KB
-
The international geography (1916) (14593463590).jpg 3,264 × 2,156; 1.24 MB
-
U.S. temp map 2012-01-31.png 2,512 × 1,383; 236 KB
-
United states average annual snowfall.jpg 1,725 × 1,100; 531 KB
-
United States Cooling Degree Day map, 1961-1990.jpg 2,100 × 1,600; 474 KB
-
United States Heating Degree Day map, 1961-1990.jpg 2,100 × 1,600; 644 KB
-
US Drought 20140304.png 1,056 × 816; 123 KB
-
US precipitation trends.gif 600 × 714; 47 KB
-
USA-Lake-Effect-Snow-Areas.svg 211 × 149; 3.15 MB
-
USDA North-Midwest Climate zones.jpg 338 × 197; 44 KB
-
Usdroughtjune30.gif 646 × 530; 22 KB
-
Weather Map United States 1872 Albert J. Myer.jpg 4,688 × 3,536; 17.69 MB
-
Weather Map United States 1873 Albert J. Myer.jpg 4,688 × 3,296; 15.17 MB
-
Westernheatwave2007.gif 550 × 425; 19 KB
-
Winter 1936 US Precipitation.gif 661 × 462; 413 KB
-
Winter 1936 US Temperature.gif 667 × 462; 417 KB
-
Year book of the State of Colorado- 1918 - DPLA - c3fbc2c5662881dd3c0a319591278771 (page 2).jpg 9,493 × 7,531; 23.83 MB
-
Year book of the State of Colorado- 1919 - DPLA - 75115d4be811a27b96224df096735636 (page 2).jpg 9,529 × 7,573; 22.37 MB
-
Year book of the State of Colorado- 1920 - DPLA - 42cf5f536f9e4d784592c87f5cd1fbb2 (page 2).jpg 9,584 × 7,532; 22.02 MB
-
Year book of the State of Colorado- 1921 - DPLA - 2a104b180d378e98490430b0457f1726 (page 2).jpg 9,484 × 7,500; 22.05 MB
-
Year book of the State of Colorado- 1922 - DPLA - 6ab0639a506f6141c73597c3e2762beb (page 2).jpg 9,495 × 7,525; 22.69 MB
-
Year book of the State of Colorado- 1923 - DPLA - 0e545440bcd7fe309989c595269f5358 (page 2).jpg 9,501 × 7,479; 22.29 MB
-
Year book of the State of Colorado- 1924 - DPLA - 5a13905acbdc79853553bc9dbe07f441 (page 2).jpg 9,452 × 7,296; 21.71 MB
-
Year book of the State of Colorado- 1926 - DPLA - ef5bba8c1b9b89f743d8eb0ac77ebbc5 (page 2).jpg 11,159 × 8,297; 27.63 MB
-
Year book of the State of Colorado- 1927 - DPLA - b34833117d3e99ba60044e8388950490 (page 2).jpg 11,099 × 8,287; 28.04 MB
-
Zin200512 pg.gif 650 × 534; 71 KB
-
Кліматичні зони США.png 701 × 565; 55 KB


