Category:Choropleth maps using absolute numbers
This category collects examples of choropleth maps that should be re-produced by properly applying cartographic methods. These misleading maps should afterwards be deleted.
Examples:
Population vs Population density: A good population density map shows the topic with a color gradient (i.e. true choropleth map) or a tiered color gradient by classes. That means, the choropleths are directly showing the ratio of population to the area. (A good population map shows absolute numbers in "blob diagrams" or some similar method.) A BAD choropleth map displays the total population (absolute number) with the color gradient, showing the densely populated urban areas (often tiny districts!) with low saturation but the wide open rural districts with a deep saturation, thus exaggerating the impact of the rural population.
Maps showing GDP: A good choropleth map shows the ratio of the GDP and the population with a color gradient. That means, the choropleths are no longer connected to the area in a meaningful way, but the ratio is still meaningful because it refers to "GDP divided by population". (A good total-GDP map shows the absolute number of the GDP in a diagram.) A BAD choropleth map displays the total GDP with the color gradient, without regards to the number of the people in the district/area that are earning that GDP.
Applied to production: If Guyana and Brazil both produce 1 Million bananas, the per-area and the per-population production of Guyana is much higher than the production of Brazil. A choropleth map that displays all of Guyana and all of Brazil in the same color, exaggerates Brazil in a huge way (Brazil is 40 times larger and has 270 times more inhabitants)
Other: Prime example including description in the file: Education
Subcategories
This category has only the following subcategory.
C
Media in category "Choropleth maps using absolute numbers"
The following 123 files are in this category, out of 123 total.
-
2017 Sweden population per county-sv.svg 664 × 1,003; 136 KB
-
Africa pop map.png 1,800 × 1,575; 254 KB
-
Aged Population (+65) In 2010.png 3,507 × 2,480; 897 KB
-
Aged Population (+65) In 2018.png 3,507 × 2,480; 902 KB
-
American countries by population, 2018.png 4,752 × 6,510; 1.28 MB
-
American FactFinder - Results - Google Chrome 2016-03-15 17.52.05.png 882 × 701; 255 KB
-
Arrecadaçao de ICMS.png 682 × 650; 526 KB
-
Asia population map.png 1,950 × 1,725; 384 KB
-
County population map.webp 2,066 × 1,369; 290 KB
-
COVID-19 Cases in Cusco.svg 512 × 620; 81 KB
-
COVID-19 Cases in Madre de Dios by districts.svg 744 × 1,052; 125 KB
-
COVID-19 Cases in Spain by Community.svg 744 × 1,052; 269 KB
-
COVID-19 Deaths in Cusco.svg 512 × 620; 81 KB
-
COVID-19 deaths in Peru.svg 512 × 724; 80 KB
-
COVID-19 deaths in the provinces of Cusco, Peru.svg 512 × 620; 74 KB
-
COVID-19 Outbreak Cases in Mexico 2.png 875 × 541; 43 KB
-
COVID-19 Outbreak Cases in Mexico.svg 1,052 × 744; 226 KB
-
COVID-19 Outbreak Cases in Peru.svg 512 × 724; 80 KB
-
COVID-19 Outbreak Cases in Romania.svg 800 × 533; 133 KB
-
COVID-19 Outbreak Cases Map in Europe.svg 680 × 520; 669 KB
-
COVID-19 pandemic in Cusco by districts.png 361 × 429; 8 KB
-
COVID-19 pandemic in Cusco by provinces.svg 512 × 620; 74 KB
-
COVID-19 pandemic in Peru by districts.svg 744 × 1,052; 290 KB
-
COVID-19 Per Capita Mortality Rate in Cusco.svg 512 × 620; 75 KB
-
COVID-19 Tests in Cusco.svg 512 × 620; 81 KB
-
COVID-19 Vaccination in Cusco.svg 512 × 620; 81 KB
-
Cáceres - Mapa municipal población.png 2,000 × 1,062; 507 KB
-
Demografia Comarca Alfaro 2015.jpg 456 × 503; 43 KB
-
Demografia Comarca Anguiano 2015.jpg 920 × 814; 183 KB
-
Demografia Comarca Arnedo 2015.jpg 716 × 602; 154 KB
-
Demografia Comarca Arnedo 2016.jpg 627 × 468; 123 KB
-
Demografia Comarca Calahorra 2015.jpg 456 × 503; 46 KB
-
Demografia Comarca Camero Viejo 2015.jpg 608 × 492; 116 KB
-
Demografia Comarca Cervera 2015.jpg 440 × 390; 77 KB
-
Demografia Comarca Cervera 2020.jpg 750 × 445; 102 KB
-
Demografia Comarca Ezcaray 2015.jpg 368 × 418; 65 KB
-
Demografia Comarca Haro 2015.jpg 679 × 395; 71 KB
-
Demografia Comarca Logroño 2015.jpg 935 × 635; 68 KB
-
Demografia Comarca Najera 2015.jpg 464 × 420; 119 KB
-
Demografia Comarca Santo Domingo 2015.jpg 472 × 426; 106 KB
-
Demografia en Municipios-de-La-Rioja-1900.png 2,000 × 1,346; 413 KB
-
Demografia en Municipios-de-La-Rioja-2015.png 2,000 × 1,346; 407 KB
-
Departamentos de Argentina por población.jpg 9,289 × 16,571; 18.14 MB
-
Departamentos por superficie.jpg 9,289 × 16,571; 18.77 MB
-
Distribution of Gurjars within South Asia.jpg 425 × 321; 44 KB
-
Dutch provinces by nominal GRP in 2016.png 4,290 × 4,700; 1.12 MB
-
England counties population (crop).jpg 1,083 × 1,321; 127 KB
-
England counties population (crop).png 1,083 × 1,321; 181 KB
-
Eritrean population in Germany by state.svg 1,073 × 1,272; 610 KB
-
Eritrean population in Italy by province.svg 1,200 × 1,500; 1.89 MB
-
Estimated number of hermits per country.png 4,592 × 3,196; 726 KB
-
Ethiopian population in Italy by province.svg 1,200 × 1,500; 1.89 MB
-
French departments by legal population (2013).png 6,300 × 6,220; 3.56 MB
-
German states by nominal GRP in 2017.png 4,235 × 4,505; 1.27 MB
-
Italian provinces by population (2011).png 5,300 × 6,785; 2.63 MB
-
Jewish diaspora in Europe.png 2,458 × 2,048; 655 KB
-
LDS membership by US states (2021).svg 959 × 593; 80 KB
-
Lista de municípios do Rio de Janeiro em Mapa (Censo 2022).png 1,980 × 1,300; 517 KB
-
Map Enslaved population in the USA in 1860.jpg 1,027 × 589; 129 KB
-
Map of coronavirus cases in Latin America by second-level administrative division.png 3,638 × 3,991; 1.28 MB
-
MAPA ACTUALIZADO AL 14-05-2020 CORONAVIRUS PERU.png 1,000 × 1,463; 263 KB
-
Mapa brasileiro da população.png 780 × 687; 96 KB
-
Mapa coronavirus Perú Por Regiones 14-05-2020.png 1,000 × 1,463; 361 KB
-
Mapa COVID-19 De España Por Comunidad Autónoma.png 559 × 431; 24 KB
-
Mapa COVID-19 De España Por Provincia.png 559 × 431; 31 KB
-
Mapa de Argentina (Subdivisiones de segundo orden) con casos confirmados de coronavirus.png 2,096 × 3,840; 1.74 MB
-
Mapa de casos confirmados de COVID-19 en el departamento de Cusco.png 909 × 1,025; 113 KB
-
Mapa del Coronavirus (COVID-19) Por Departamento De Córdoba.png 601 × 981; 13 KB
-
Mapa del Coronavirus (COVID-19) Por Departamento De Jujuy.png 428 × 432; 5 KB
-
Mapa del Coronavirus (COVID-19) Por Departamento De La Pampa.png 675 × 739; 21 KB
-
Mapa del Coronavirus (COVID-19) Por Departamento De Mendoza.png 598 × 1,000; 11 KB
-
Mapa del Coronavirus (COVID-19) Por Departamento De Neuquén.png 584 × 965; 11 KB
-
Mapa del Coronavirus (COVID-19) Por Departamento De Salta.png 647 × 495; 9 KB
-
Mapa del Coronavirus (COVID-19) Por Departamento De Santa Cruz.png 1,163 × 1,445; 18 KB
-
Mapa del Coronavirus (COVID-19) Por Departamento De Santa Fe.png 984 × 1,728; 68 KB
-
Mapa del Coronavirus (COVID-19) Por Departamento En Beni.png 403 × 422; 22 KB
-
Mapa del Coronavirus (COVID-19) Por Departamento En Bolivia.png 1,817 × 2,067; 36 KB
-
Mapa del Coronavirus (COVID-19) Por Provincia En Bolivia.png 469 × 532; 48 KB
-
Mapa del Coronavirus (COVID-19) Por Provincia En Ecuador.png 342 × 374; 5 KB
-
Mapa del Covid-19 en América Central.png 600 × 600; 100 KB
-
Mapa del Perú y provincias afectadas por el SARS-CoV-2.png 791 × 992; 38 KB
-
Mapa del Perú y provincias afectadas.png 917 × 1,024; 64 KB
-
Mapa distrital de Covid-19 en el Perú.png 1,432 × 1,958; 144 KB
-
Mapa distrital de Lima con casos confirmados de coronavirus.png 497 × 793; 13 KB
-
Mapa Mortal del Coronavirus (COVID-19) Por Departamento De Salta.png 647 × 495; 20 KB
-
Mapa Mortal del Coronavirus (COVID-19) Por Departamento De Santa Fe.png 984 × 1,728; 68 KB
-
MAPA PROVINCIAL (COMANDO COVID-19) - PERÚ.png 1,000 × 1,463; 254 KB
-
North america pop map.png 1,799 × 1,649; 345 KB
-
Number of metropolitan areas with GDP over 50 billion.png 4,592 × 3,196; 1.22 MB
-
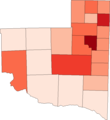
Penns Valley Demographics Map 2010.png 467 × 373; 248 KB
-
People with Palestinian ancestry in South America.jpg 1,414 × 1,484; 207 KB
-
Peoples of South Asia Sindhi Sumra.png 970 × 733; 404 KB
-
PH provinces population.PNG 2,000 × 3,120; 226 KB
-
Población de la provincia de Navarra.png 2,000 × 2,142; 714 KB
-
Población de la provincia de Soria.png 1,280 × 1,024; 304 KB
-
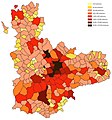
Población de la provincia de Valladolid.jpg 2,000 × 2,139; 1.62 MB
-
Población La Mancha de Cuenca.jpg 1,632 × 1,689; 608 KB
-
Población Manchuela.jpg 1,404 × 997; 260 KB
-
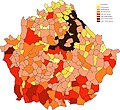
Población por municipios de la provincia de Cuenca.jpg 2,733 × 2,511; 1.41 MB
-
Población por municipios de la provincia de Teruel.jpg 1,120 × 1,062; 420 KB
-
Población Serranía.jpg 1,825 × 1,775; 611 KB
-
Polish voivodeships by gross regional product GRP per capita 2019.png 6,000 × 4,650; 1.31 MB
-
Population of the USA by state.png 5,000 × 3,500; 1.04 MB
-
Prison population in Europe.jpg 4,095 × 2,850; 1.39 MB
-
Provinces of Belgium by population (2017).png 4,290 × 3,605; 918 KB
-
Provinces of Sweden by population (2016).png 3,900 × 6,690; 1.23 MB
-
Refugees in Lebanon - UNHCR.jpg 640 × 746; 88 KB
-
Sevilla-densidad-poblacion-2018.png 1,000 × 1,000; 120 KB
-
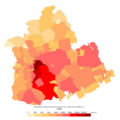
Sevilla-poblacion-2018.png 1,000 × 1,000; 125 KB
-
Shires of Scotland by population (2011).png 940 × 1,226; 353 KB
-
South African diaspora.jpg 1,414 × 1,665; 423 KB
-
South america population map.png 1,753 × 1,649; 196 KB
-
Turkeli.png 976 × 574; 61 KB


