Category:Charts showing data through 2050
Jump to navigation
Jump to search
| NO WIKIDATA ID FOUND! Search for Charts showing data through 2050 on Wikidata | |
| Upload media |
English: Charts showing data up to some year and projections until the year 2050. Many charts are still missing – please help categorizing charts, e.g. from here. Outdated charts can often be updated.
Subcategories
This category has the following 4 subcategories, out of 4 total.
2
Media in category "Charts showing data through 2050"
The following 42 files are in this category, out of 42 total.
-
 Carbon budget eng.png 989 × 758; 279 KB
-
 Cost-of-storms-by-decade.gif 444 × 344; 7 KB
-

-
 Extrapolated change in plastic fate to 2050, OWID.svg 850 × 600; 13 KB
-
 FAO projections of arable land to 2050, OWID.svg 850 × 600; 8 KB
-
 Folketal sverige 1991 2050 per aldersgruppe.png 1,748 × 876; 26 KB
-
 Food-, land-, and climate change mitigation-gaps for 2050.jpg 2,813 × 719; 329 KB
-

-

-
 Global-meat-projections-to-2050 (OWID 0533).png 850 × 600; 72 KB
-
 Growthbydevelopedvslessdeveloped.jpg 604 × 407; 37 KB
-
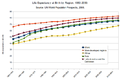 Life Expectancy at Birth by Region 1950-2050.png 728 × 485; 35 KB
-
 Life Expectancy At Birth By Region.png 973 × 534; 69 KB
-
 Life Expectancy at Birth for Males and Females - USA - 1950-2050.png 1,050 × 582; 29 KB
-

-
 Macroplastics in the surface ocean, OWID.svg 850 × 600; 20 KB
-
 Macroplastics-in-ocean (OWID 0563).png 850 × 600; 73 KB
-
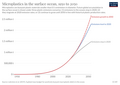
 Microplastics in the surface ocean, OWID.svg 850 × 600; 20 KB
-
 Microplastics-in-ocean (OWID 0661).png 850 × 600; 71 KB
-
 Nitrous oxide emissions from agriculture, OWID.svg 850 × 600; 19 KB
-
 Northern Ireland population pyramid from 1971 to projections to 2050.gif 1,200 × 983; 566 KB
-

-
 Percentage of Population Residing in Urban Areas 1950-2050.png 1,658 × 707; 114 KB
-
 Percentage of the World Population Over 65 - 1950-2050.png 707 × 500; 23 KB
-
 Percentage of US Population Over Age 65 1950-2050.png 744 × 503; 18 KB
-
 Plastic-fate-to-2050 (OWID 0842).png 850 × 600; 70 KB
-
 Population Growth in Africa, 1950 - 2050.png 946 × 569; 104 KB
-

-
 Projected change in under-5 population from 2015 to 2050, OWID.svg 850 × 600; 140 KB
-

-
 Projection of the Demographics in USA.jpg 732 × 474; 56 KB
-
 Projections for global peak agricultural land, OWID.svg 850 × 600; 12 KB
-
 Racial Ethnic Composition of the United States 1970 2050 (cropped).png 2,100 × 1,389; 103 KB
-
 Racial Ethnic Composition of the United States 1970 2050.jpg 2,048 × 1,413; 663 KB
-
-

-
 Top 10 2050.jpg 586 × 306; 23 KB
-
 Total fertility rate 1950-2021 in regios.png 605 × 493; 104 KB
-

-
 US energy consumption 2010-2050.png 800 × 600; 35 KB
-
 Usa-poblacion.jpg 601 × 286; 24 KB
-
 World potential GDP benefit under net zero by 2050 (IMF).svg 835 × 600; 11 KB


.png)


.png)

.png)


,_following_different_Shared_Socio-economic_Pathways_(SSPs).webp)


.png)


.png)


),_OWID.svg)


.svg)
-Predicting-Future-Trends-pone.0047981.g003.jpg)
-Predicting-Future-Trends-pone.0047981.g006.jpg)