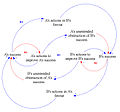
Category:Causal loop diagram
Jump to navigation
Jump to search
causal diagram that aids in visualizing how different variables in a system are interrelated. The diagram consists of a set of nodes and edges | |||||
| Upload media | |||||
| |||||
A causal-loop diagram (CLD) is a diagram that aids in visualizing how interrelated variables affect one another.
Media in category "Causal loop diagram"
The following 27 files are in this category, out of 27 total.
-
Accidental Adversaries Causal Loop.jpg 882 × 823; 267 KB
-
Adoption CLD.png 528 × 240; 4 KB
-
Adoption CLD.svg 528 × 240; 114 KB
-
Attractiveness principle-casual loop.svg 774 × 429; 39 KB
-
Attractivness principle-causal loop.svg 773 × 429; 97 KB
-
Car feedback.png 1,041 × 564; 78 KB
-
Carbon Cycle.png 1,282 × 695; 370 KB
-
Causal Loop Diagram of a Model.png 645 × 370; 55 KB
-
CLD positive ANI.gif 264 × 308; 19 KB
-
Delay.JPG 314 × 179; 8 KB
-
Drogy.JPG 319 × 173; 11 KB
-
Economic analysis chart of movement towards sustainability.jpg 871 × 510; 56 KB
-
Elements of Low-Carbon Urban Development.png 3,718 × 4,159; 322 KB
-
Error-controlled regulation.png 741 × 351; 26 KB
-
Ftf.jpg 293 × 314; 25 KB
-
Kritika.JPG 532 × 208; 15 KB
-
Oscilace.JPG 491 × 404; 11 KB
-
Radical Acceptance diagram.jpg 198 × 204; 7 KB
-
SampleDiagram.JPG 699 × 577; 44 KB
-
Set-point control.png 1,577 × 610; 92 KB
-
Smycka00.JPG 360 × 205; 10 KB
-
Stampede loop.png 360 × 180; 9 KB
-
The Vicious Cycle of Predict and Provide (cropped).png 3,737 × 3,547; 151 KB
-
The Vicious Cycle of Predict and Provide.png 3,745 × 4,159; 397 KB
-
Vztah00.JPG 337 × 117; 5 KB
-
Vztah01.JPG 337 × 117; 4 KB


