Category:Catalan-language SVG charts
Jump to navigation
Jump to search
Media in category "Catalan-language SVG charts"
The following 74 files are in this category, out of 74 total.
-
 2006 temp anom-german.svg 741 × 488; 37 KB
-
 2010- Cost of renewable energy - IRENA.svg 1,000 × 750; 8 KB
-
 AA Alkaline battery energy usage - discharge current 100mA.svg 725 × 525; 37 KB
-
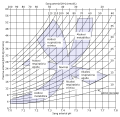 Acid-base nomogram cat.svg 580 × 565; 78 KB
-
 ACTH Negative Feedback-ca.svg 259 × 273; 16 KB
-
 AcuityHumanEye CAT.svg 724 × 547; 19 KB
-
 Alcala de Henares population growth.svg 700 × 493; 37 KB
-
 Aluminium - world production trend.svg 750 × 630; 11 KB
-
 AmdahlsLaw-ca.svg 640 × 500; 4 KB
-
 Archibio.svg 480 × 440; 3 KB
-
 Binding energy curve - common isotopes.svg 671 × 441; 22 KB
-
 Biodiversitat fanerozoic.svg 627 × 371; 139 KB
-
 Brazilpop.svg 800 × 600; 26 KB
-
 ChandrasekharLimitGraph ca.svg 1,052 × 744; 30 KB
-
 Clock accuracy.svg 460 × 273; 77 KB
-
 Cmbr.svg 600 × 480; 18 KB
-
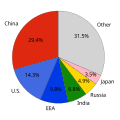 CO2 emission pie chart.svg 540 × 540; 76 KB
-
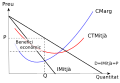 Competencia imperfecta curt termini.svg 580 × 400; 5 KB
-
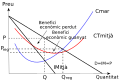 Competencia imperfecta despres regulacio.svg 580 × 400; 7 KB
-
 Competencia perfecta curt termini(simple).svg 580 × 400; 4 KB
-
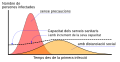 COVID-19 Health care limit-ca.svg 1,102 × 565; 129 KB
-
 COVID-19-Brazil-log.svg 540 × 405; 101 KB
-
 CPR Basic CAT.svg 741 × 1,168; 49 KB
-
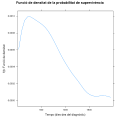
 Delta-O-18 en sediments d'aigües profundes.svg 746 × 468; 51 KB
-
 Diagrama Brill aparent-Temps - Estrelles brillants ca.svg 720 × 420; 83 KB
-
 Divisions dels Elfs - esquema simplificat.svg 800 × 404; 26 KB
-
 Drug discovery cycle-ca.svg 820 × 666; 28 KB
-
 Dunning–Kruger Effect 01.svg 512 × 426; 8 KB
-
 ECG in hyperkalemia-ca.svg 480 × 839; 44 KB
-

-
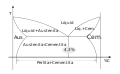 Eutectic system-Steel-ca.svg 420 × 260; 12 KB
-
 Evolution of a Sun-like star CA.svg 730 × 680; 17 KB
-
 Flow-volume-loop CAT.svg 702 × 813; 56 KB
-
 FreeWillTaxonomy2-ca.svg 806 × 467; 7 KB
-
-
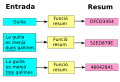 Funció resum ca.svg 520 × 352; 18 KB
-
 Global Distribution of Wealth v3 CAT.svg 600 × 476; 292 KB
-
 Grafic dun cos negre.svg 303 × 259; 8 KB
-
 Hematopoiesis (human) diagram ca.svg 1,425 × 1,095; 4.5 MB
-
 Hiv-timecourse ca.svg 729 × 433; 52 KB
-
 Holocene Sea Level-es.svg 512 × 364; 31 KB
-
 Hyperalgesia and allodynia-ca.svg 945 × 641; 21 KB
-
 Incretins and DPP 4 inhibitors-ca.svg 522 × 317; 132 KB
-
 InflammationPaths CAT.svg 580 × 390; 33 KB
-
 Inflation graph argentina.svg 425 × 315; 36 KB
-
 ITD (catalan).svg 2,640 × 1,768; 2.54 MB
-
 Kép1-ca.svg 1,158 × 895; 145 KB
-
 Largenumbers.svg 600 × 480; 25 KB
-
 Masa de triton.svg 898 × 635; 26 KB
-
 Mauna Loa CO2 monthly mean concentration-ca.svg 708 × 708; 438 KB
-
 Melting curve of water-ca.svg 605 × 340; 59 KB
-
 Moon vs earth composition-ca.svg 600 × 480; 34 KB
-
 Near-stars-past-future-en.svg 999 × 800; 54 KB
-
 Negative and positive skew diagrams (Catalan).svg 448 × 174; 6 KB
-
 Nuclear energy generation.svg 642 × 525; 12 KB
-
 Operating system placement ca.svg 250 × 370; 19 KB
-
 Phanerozoic Biodiversity-ca.svg 784 × 464; 204 KB
-
 Phase change - ca.svg 429 × 425; 16 KB
-
 Phonocardiograms from normal and abnormal heart sounds-ca.svg 731 × 872; 113 KB
-
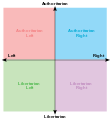 Political chart.svg 543 × 590; 14 KB
-
 QALY graph-ca.svg 750 × 531; 113 KB
-
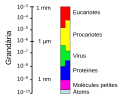 Relative scale.ca.svg 936 × 762; 16 KB
-
 Relativesweetness.svg 512 × 330; 10 KB
-
 SinusRhythmLabels CAT.svg 1,046 × 1,125; 14 KB
-
 Solar evolution (Catalan).svg 544 × 388; 24 KB
-
 Solar-cycle-data-ca.svg 868 × 578; 90 KB
-
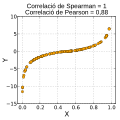 Spearman fig1 ca.svg 353 × 351; 69 KB
-
 Spearman fig2 ca.svg 353 × 351; 64 KB
-
 Spearman fig3 ca.svg 353 × 351; 62 KB
-
 Sunspot area variation.svg 1,613 × 430; 84 KB
-
 TallestBuildings ca.svg 1,920 × 1,080; 34 KB
-
 Three gorges dam annual power output SVG ca.svg 680 × 490; 23 KB
-
 Volums pulmonars est.svg 585 × 310; 25 KB
-
 Yangtze River flow rate at TGD site ca.svg 680 × 400; 67 KB


.svg)


_diagram_ca.svg)


.svg)


.svg)


.svg)