Category:Carbon cycle
Jump to navigation
Jump to search
biogeochemical cycle by which carbon is exchanged among the biosphere | |||||
| Upload media | |||||
| Subclass of | |||||
|---|---|---|---|---|---|
| Facet of | |||||
| Has part |
| ||||
| Different from | |||||
| |||||
Subcategories
This category has the following 7 subcategories, out of 7 total.
Media in category "Carbon cycle"
The following 200 files are in this category, out of 205 total.
(previous page) (next page)-
2021 Remaining Carbon Budget.svg 512 × 258; 8 KB
-
A-Role-for-Programmed-Cell-Death-in-the-Microbial-Loop-pone.0062595.s005.ogv 7.1 s, 175 × 175; 67 KB
-
A-Role-for-Programmed-Cell-Death-in-the-Microbial-Loop-pone.0062595.s006.ogv 2.6 s, 1,024 × 512; 365 KB
-
Annual carbon primary production on land and in the ocean.jpg 1,074 × 1,280; 199 KB
-
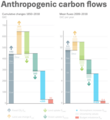
Anthropogenic carbon flows 1850-2018.png 2,067 × 2,253; 157 KB
-
Anthropogenic changes in the global carbon cycle.png 2,067 × 1,250; 143 KB
-
Asphalt and Metal - 1 of 5.jpg 2,448 × 3,264; 978 KB
-
Asphalt and Metal 2 of 5.jpg 3,264 × 2,448; 798 KB
-
Asphalt and Metal 3 of 5.jpg 1,536 × 2,048; 749 KB
-
Asphalt and Metal 5 of 5.jpg 3,264 × 2,448; 1.27 MB
-
Atmospheric CO2 impulse response.svg 992 × 744; 349 KB
-
Bg-11-3547-2014.pdf 1,239 × 1,635, 56 pages; 3.99 MB
-
Biochem.svg 425 × 378; 81 KB
-
Biogeochem.svg 425 × 378; 50 KB
-
Biomass source and sink processes of benthic animals.jpg 997 × 685; 85 KB
-
Carbon biogeochemical cycle.png 896 × 574; 156 KB
-
Carbon capture and storage.png 1,000 × 1,001; 232 KB
-
Carbon Cycle (8265010034).jpg 580 × 447; 121 KB
-
Carbon cycle -ar.jpg 2,600 × 2,192; 2.36 MB
-
Carbon cycle el.jpg 1,000 × 445; 63 KB
-
Carbon Cycle in Peatlands.pdf 1,066 × 600; 6.2 MB
-
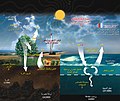
Carbon cycle NASA.jpg 900 × 700; 141 KB
-
Carbon cycle numerical experimental design.png 1,150 × 731; 299 KB
-
Carbon cycle pl.tif 2,600 × 2,192; 22.27 MB
-
Carbon cycle processes in high-latitude shelf seas.jpg 2,953 × 1,574; 319 KB
-
Carbon cycle with the added effect of plastic.jpg 1,084 × 854; 580 KB
-
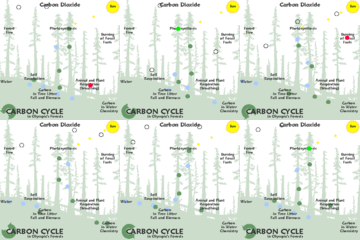
Carbon Cycle-animated forest.gif 400 × 400; 332 KB
-
Carbon cycle-cute diagram ar.svg 540 × 417; 118 KB
-
Carbon cycle-cute diagram ca.png 500 × 386; 103 KB
-
Carbon cycle-cute diagram cs.svg 540 × 417; 205 KB
-
Carbon cycle-cute diagram da.svg 540 × 417; 151 KB
-
Carbon cycle-cute diagram nl.jpg 848 × 659; 98 KB
-
Carbon cycle-cute diagram pt.svg 540 × 417; 135 KB
-
Carbon cycle-cute diagram ta.svg 540 × 417; 152 KB
-
Carbon cycle-cute diagram zh-hant.svg 540 × 417; 339 KB
-
Carbon cycle-cute diagram-ca.svg 563 × 431; 269 KB
-
Carbon cycle-cute diagram-espanol.svg 540 × 417; 194 KB
-
Carbon cycle-cute diagram-fa.jpg 856 × 657; 105 KB
-
Carbon cycle-cute diagram-german.png 2,000 × 1,544; 667 KB
-
Carbon cycle-cute diagram-german.svg 540 × 417; 249 KB
-
Carbon cycle-cute diagram-no.svg 512 × 393; 97 KB
-
Carbon cycle-cute diagram-zh-Hans.jpeg 540 × 417; 122 KB
-
Carbon cycle-cute diagram.jpeg 540 × 417; 52 KB
-
Carbon cycle-cute diagram.svg 600 × 460; 65 KB
-
Carbon cycle-cute-diagram-fi.svg 540 × 417; 188 KB
-
Carbon cycle-flux diagram.jpeg 800 × 651; 95 KB
-
Carbon cycle-simple diagram-pt.svg 847 × 675; 59 KB
-
Carbon cycle-simple diagram.png 419 × 340; 32 KB
-
Carbon cycle-simple diagram.svg 423 × 337; 60 KB
-
Carbon cycle.jpg 2,600 × 2,192; 728 KB
-
Carbon cycle.svg 724 × 472; 18 KB
-
Carbon dioxide emission from streams and rivers.png 746 × 458; 356 KB
-
Carbon dioxide emissions global carbon cycle.jpg 2,998 × 2,248; 1.01 MB
-
Carbon Dioxide Partitioning-cs.svg 960 × 696; 561 KB
-
Carbon Dioxide Partitioning-vi.svg 960 × 696; 561 KB
-
Carbon Dioxide Partitioning.svg 960 × 696; 57 KB
-
Carbon footprint.jpg 2,476 × 3,484; 1.02 MB
-
Carbon forms exchanged between land, air, and ocean in coastal regions.png 1,487 × 1,633; 1.98 MB
-
Carbon oxygen cycle aerobic.svg 503 × 390; 26 KB
-
Carbon oxygen cycle anaerobic.svg 379 × 390; 17 KB
-
Carbon processing at the seafloor.png 869 × 444; 159 KB
-
Carbon processing in marine sediments.jpg 2,067 × 1,204; 230 KB
-
Carbon sequestration-2009-10-07-tr.svg 530 × 420; 209 KB
-
Carbon sequestration-2009-10-07.es.png 574 × 451; 122 KB
-
Carbon sequestration-2009-10-07.svg 530 × 420; 208 KB
-
Carbon sequestration-NL.svg 530 × 420; 235 KB
-
Carbon stored in ecosystems.png 2,535 × 1,216; 120 KB
-
Carbon-footprint-of-EU-diets-by-supply-chain.png 4,105 × 3,946; 452 KB
-
Carbon-Slicate Cycle Feedbacks.jpg 846 × 951; 114 KB
-
Carbonate-Silicate Cycle (Carbon Cycle focus).jpg 550 × 405; 232 KB
-
CCycle cover image.jpg 1,200 × 964; 181 KB
-
Ccycle.png 851 × 545; 57 KB
-
Climate change carbon cycle.png 1,549 × 1,168; 312 KB
-
Climate change causes sea ice to melt.jpg 765 × 738; 260 KB
-
Climate change disturbances of rainforests infographic.jpg 829 × 1,116; 567 KB
-
Climate–carbon cycle feedbacks and state variables.png 1,900 × 684; 173 KB
-
Climate–carbon cycle feedbacks.png 1,198 × 420; 99 KB
-
CO2 flux IPCC.jpg 500 × 308; 85 KB
-
CO2 pump hg-ru.svg 679 × 475; 8 KB
-
CO2 pump hg.png 1,155 × 806; 184 KB
-
CO2 pump hg.svg 720 × 505; 46 KB
-
Coastal carbon transport and flux from rivers.jpg 1,064 × 1,329; 354 KB
-
Comparison of zooplankton-mediated carbon cycles.jpg 3,900 × 2,196; 656 KB
-
Cycle C.jpg 1,000 × 795; 102 KB
-
Cycle carbone1-2009-15-02.png 1,023 × 570; 20 KB
-
Cycle carbone1.png 1,023 × 570; 20 KB
-
Cycle du carbone - 2.png 1,023 × 570; 11 KB
-
Cycle du carbone.png 1,024 × 768; 155 KB
-
Cycle du carbone2.svg 1,022 × 570; 30 KB
-
Cyclecarbone.jpg 1,024 × 768; 146 KB
-
Cykl węglowy.png 1,920 × 1,072; 3.29 MB
-
Den geologiske karbonsyklusen.jpg 549 × 283; 63 KB
-
Diagrama carbono lindo esp.svg 540 × 417; 115 KB
-
Diatoms and picophytoplankton in the marine C and Si cycles.jpg 2,032 × 1,026; 404 KB
-
Different approaches to carbon processing in marine sediments.png 2,067 × 830; 105 KB
-
Déséquilibre du cycle du carbone.png 535 × 338; 45 KB
-
Early Earth - Solar and CO2 relationship.png 1,341 × 744; 155 KB
-
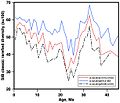
Effect of near-surface temperature corrections.webp 986 × 760; 41 KB
-
ESPAÑOL Carbon cycle.jpg 2,600 × 2,192; 1.88 MB
-
Fate of Buried Organic Matter.jpg 1,024 × 711; 92 KB
-
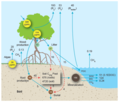
Fate of mangrove primary production.jpg 1,423 × 1,036; 197 KB
-
Fates of soil CO2.png 1,043 × 829; 152 KB
-
Figure 22 03 01.jpg 1,117 × 778; 714 KB
-
Flux of crustal material in the mantle ar.jpg 1,942 × 1,112; 718 KB
-
Food web structure in the euphotic zone.png 1,067 × 950; 65 KB
-
Forms of carbon in deep Earth.jpg 2,000 × 1,388; 522 KB
-
G2010-106 NPP ReportersPackage ipod lg.ogv 3 min 44 s, 400 × 226; 15 MB
-
Geochem.svg 425 × 378; 44 KB
-
Global carbon budget components.png 2,067 × 2,597; 341 KB
-
Global Carbon Cycle (8263952221).jpg 1,200 × 1,003; 338 KB
-
Global carbon cycle.png 2,067 × 1,253; 126 KB
-
Global carbon cycle.webp 780 × 547; 71 KB
-
Global carbon stocks.png 2,550 × 1,053; 115 KB
-
Global ocean-atmosphere CO2 fluxes 1992–2018.webp 955 × 1,342; 112 KB
-
Ice sheets in the global carbon cycle.png 1,043 × 673; 262 KB
-
Impact of elevated CO2 on soil carbon reserves-es.png 500 × 332; 56 KB
-
Impact of elevated CO2 on soil carbon reserves.gif 500 × 332; 70 KB
-
Impacts-on-the-Deep-Sea-Ecosystem-by-a-Severe-Coastal-Storm-pone.0030395.s003.ogv 22 s, 1,440 × 1,080; 8.34 MB
-
Innoko NWR collapse scar bogs.jpg 640 × 480; 211 KB
-
Interactions between marine biogeochemical carbon, nitrogen and phosphorus cycles.pdf 1,327 × 1,664; 1.86 MB
-
IPCCStockCarboneSolsVégétationFr.jpg 1,122 × 619; 187 KB
-
Karbonkretsløp 1700.png 1,089 × 1,200; 28 KB
-
Karbonkretsløp 2005.png 1,441 × 1,200; 34 KB
-
Karbonoaren zikloa.png 431 × 366; 49 KB
-
Kohlenstoffzyklus elemente.svg 238 × 307; 25 KB
-
Koolstofkringloop.png 1,115 × 969; 140 KB
-
KoolstofkringloopDutchtext.png 1,114 × 976; 96 KB
-
Lanl2.png 640 × 332; 52 KB
-
Long-term carbon and strontium cycles.jpg 2,382 × 2,153; 424 KB
-
Long-term carbon cycle.jpg 2,345 × 1,063; 310 KB
-
LzKSK.pdf 2,320 × 2,018; 135 KB
-
Main sources of ocean dissolved organic carbon.jpg 874 × 782; 74 KB
-
Marine carbon cycle.jpg 1,000 × 725; 158 KB
-
Marine export production.jpg 743 × 544; 243 KB
-
Mass balance model of carbon flow through the world’s mangrove ecosystems.webp 2,842 × 2,447; 291 KB
-
Mesopelagic species impact on global carbon budget.png 671 × 602; 299 KB
-
Microscale heterogeneity in the ocean.jpg 1,280 × 741; 104 KB
-
Modern global transfers of carbon between geological and active inventories.png 1,402 × 1,079; 65 KB
-
Nitrogen–carbon–climate interactions.jpg 630 × 636; 117 KB
-
Observation-based estimates of anthropogenic CO2 uptake.webp 961 × 820; 43 KB
-
Ocean carbon cycle and diatom carbon dioxide concentration mechanisms 2.jpg 3,967 × 3,120; 1.95 MB
-
Ocean carbon cycle and diatom carbon dioxide concentration mechanisms.jpg 3,967 × 4,530; 1.02 MB
-
Ocean DOC production and export fluxes.png 1,078 × 858; 928 KB
-
OceanCarbonCycle.jpg 500 × 471; 77 KB
-
Oddeleni uhliku.svg 530 × 420; 207 KB
-
Organic carbon cycle including the flow of kerogen.png 1,144 × 763; 912 KB
-
Organic matter supply to ocean sediments.png 1,358 × 675; 171 KB
-
Partitionnement du dioxyde de carbone.svg 960 × 696; 561 KB
-
Removal of refractory DOC in the ocean.webp 1,350 × 1,118; 100 KB
-
Representation of the inland wetland carbon cycle fenvs-08-00008-g001.jpg 2,197 × 1,330; 278 KB
-
Reservoirs and fluxes of carbon in deep Earth.png 2,000 × 1,304; 229 KB
-
Roles of fungi in the marine carbon cycle.jpg 1,280 × 739; 91 KB
-
Schema circuitului carbonului in natura.png 587 × 446; 31 KB
-
Schematic of the biological carbon pump.png 2,006 × 1,446; 258 KB
-
Simplified diagram of the global carbon cycle.jpg 964 × 599; 378 KB
-
Simplified global carbon budget and its anthropogenic perturbation.jpg 964 × 318; 219 KB
-
Soil carbon cycle through the microbial loop-es.png 2,257 × 2,500; 965 KB
-
Soil carbon cycle through the microbial loop.jpg 2,273 × 2,697; 781 KB
-
Soil microbial loop.gif 421 × 500; 88 KB
-
SRS1000 being used to measure soil respiration in the field..jpg 2,000 × 1,330; 592 KB
-
Stores and fluxes in present day ice sheets.png 1,000 × 555; 231 KB
-
Suggested mechanisms of organic carbon accumulation in seagrass.jpg 2,067 × 1,292; 308 KB
-
Terrestrial carbon escaping from inland waters.jpg 3,333 × 1,849; 587 KB
-
The Jay 1 of 3.jpg 1,868 × 1,365; 517 KB
-
The Jay 2 of 3.jpg 2,048 × 1,365; 368 KB
-
The Jay 3 of 3.jpg 691 × 773; 127 KB
-
The-carbon-cycle biosphere.png 830 × 771; 175 KB
-
Tracking Carbon from Wildfires to Ocean Blooms (SVS14315 - PACE Fires Carbon prores).webm 5 min 3 s, 1,920 × 1,080; 39.95 MB
-
Tracking Carbon from Wildfires to Ocean Blooms (SVS14315).png 3,168 × 1,620; 5.39 MB
-
Tracking Carbon from Wildfires to Ocean Blooms (SVS14315).webm 1 min 20 s, 1,920 × 1,080; 9.3 MB
-
Viral impacts on ecosystem carbon cycles.jpg 1,084 × 646; 460 KB
-
Viral regulation of ecosystem carbon cycling.jpg 1,084 × 475; 297 KB


