Category:Calculus
Jump to navigation
Jump to search
Calculus is the mathematical theory of functions in one variable. Here we collect media which describe the main properties in the theory. For special functions, see the subcategory category:functions. For functions in more than one variable, see category:multivariate calculus. For the complex case see category:complex analysis. Please put your images in an appropriate subcategory. See also Category:Dental calculus for a deposit on teeth.
| Category Calculus on sister projects: | |||||||||
|---|---|---|---|---|---|---|---|---|---|
Wiktionary |
Wikibooks |
Commons | |||||||
branch of mathematics | |||||
| Upload media | |||||
| Instance of | |||||
|---|---|---|---|---|---|
| Subclass of |
| ||||
| Discoverer or inventor | |||||
| Based on |
| ||||
| Has part(s) | |||||
| Replaces |
| ||||
| Different from | |||||
| |||||
Subcategories
This category has the following 20 subcategories, out of 20 total.
Media in category "Calculus"
The following 200 files are in this category, out of 206 total.
(previous page) (next page)-
A parametric curve with a tangent and a normal 01.png 640 × 384; 17 KB
-
A parametric curve with a tangent and a normal 02.png 640 × 384; 32 KB
-
A parametric curve with a tangent and a normal 03.png 640 × 384; 23 KB
-
A parametric curve with a tangent and a normal 04.png 640 × 384; 26 KB
-
A parametric curve with a tangent and a normal 05.png 640 × 384; 32 KB
-
AndragradsEkva.svg 336 × 414; 14 KB
-
Augšanas parādīšana.jpg 250 × 250; 33 KB
-
Beschränktheit2.png 904 × 630; 11 KB
-
Bounded and unbounded functions.svg 329 × 317; 16 KB
-
Branch of a graph with gnuplot 02.svg 800 × 480; 28 KB
-
Branch of a graph with gnuplot.svg 800 × 480; 24 KB
-
C05b The arc length of the graph of f.png 640 × 384; 20 KB
-
C05c The arc length of the graph of f.png 640 × 384; 14 KB
-
C05d The arc length of the graph of f.png 640 × 384; 14 KB
-
Calculer la courbure pour une fonction cos(x).png 640 × 384; 23 KB
-
Calculer la courbure pour une fonction exp(x**2) 01.png 640 × 384; 20 KB
-
Calculer la courbure pour une fonction log(x-1).png 640 × 384; 21 KB
-
Calculer la courbure pour une fonction paramétrique 2d 01.png 640 × 384; 24 KB
-
Calculer la courbure pour une fonction paramétrique 2d 02.png 640 × 384; 28 KB
-
Calculul unei integrale duble 098uygvbn.png 670 × 493; 24 KB
-
Calespe.png 327 × 110; 8 KB
-
Calmargi.png 396 × 124; 11 KB
-
Causal function with gnuplot and C language.png 640 × 384; 19 KB
-
Circulacion.png 337 × 285; 3 KB
-
Compute a Branch of a function 01.svg 800 × 480; 26 KB
-
Cross product of i j k.png 110 × 112; 3 KB
-
Cylinder Sphere Optimization Problem.svg 365 × 360; 15 KB
-
De-Infinitesimalrechnung.ogg 3.2 s; 31 KB
-
Derivada y recta tangente.svg 322 × 222; 38 KB
-
DifferentialExample01.svg 450 × 261; 35 KB
-
DifferentialExample02.svg 450 × 308; 28 KB
-
Divergence theorem example.svg 116 × 94; 66 KB
-
Doubledel.png 162 × 212; 8 KB
-
Draw a typical circular sector 01.png 640 × 384; 49 KB
-
Draw a typical circular sector 02.png 640 × 384; 44 KB
-
Draw tangent of a vectoriel function 01.png 640 × 384; 23 KB
-
Draw tangent of a vectoriel function 02.png 640 × 384; 27 KB
-
Draw tangent of a vectoriel function 03.png 640 × 384; 37 KB
-
Draw the tangent of a vectoriel function in 3d 01.png 640 × 384; 31 KB
-
Draw the tangent of a vectoriel function in 3d 02.png 640 × 384; 24 KB
-
Egm6341.s10.mtg2.pdf 254 × 356, 4 pages; 1.43 MB
-
ExtremeValueTheorem.png 1,300 × 975; 123 KB
-
Fig1-Katugampola.jpg 400 × 400; 15 KB
-
Fig2-Katugampola.jpg 400 × 400; 16 KB
-
Find PA, the length of the Normal from P to the x axis. 01.png 640 × 384; 17 KB
-
Find PA, the length of the Normal from P to the x axis. 02.png 640 × 384; 23 KB
-
Find PA, the length of the Normal from P to the x axis. 03.png 640 × 384; 20 KB
-
Find PA, the length of the Normal from P to the x axis. 04.png 640 × 384; 17 KB
-
Find PA, the length of the Normal from P to the x axis. 05.png 640 × 384; 23 KB
-
Find PA, the length of the tangent from P to the x axis 01.png 640 × 384; 17 KB
-
Find PA, the length of the tangent from P to the x axis 02.png 640 × 384; 23 KB
-
Find PA, the length of the tangent from P to the x axis 03.png 640 × 384; 23 KB
-
Find PA, the length of the tangent from P to the x axis 04.png 640 × 384; 19 KB
-
Find PA, the length of the tangent from P to the x axis 05.png 640 × 384; 20 KB
-
Find PB, the length of the Normal from P to the y axis. 01.png 640 × 384; 24 KB
-
Find PB, the length of the Normal from P to the y axis. 02.png 640 × 384; 20 KB
-
Find PB, the length of the Normal from P to the y axis. 03.png 640 × 384; 17 KB
-
Find PB, the length of the Normal from P to the y axis. 04.png 640 × 384; 23 KB
-
Find PB, the length of the tangent from P to the y axis 01.png 640 × 384; 18 KB
-
Find PB, the length of the tangent from P to the y axis 02.png 640 × 384; 23 KB
-
Find PB, the length of the tangent from P to the y axis 03.png 640 × 384; 23 KB
-
Find PB, the length of the tangent from P to the y axis 04.png 640 × 384; 19 KB
-
Find PB, the length of the tangent from P to the y axis 05.png 640 × 384; 20 KB
-
Find the intersection points of the normal with the x-y axis 01.png 640 × 384; 23 KB
-
Find the intersection points of the normal with the x-y axis 02.png 640 × 384; 25 KB
-
Find the intersection points of the normal with the x-y axis 03.png 640 × 384; 22 KB
-
Find the intersection points of the normal with the x-y axis 04.png 640 × 384; 19 KB
-
Find the intersection points of the normal with the x-y axis 05.png 640 × 384; 26 KB
-
Five Antiderivatives of exp(xx+1div(xx)) II.png 1,232 × 934; 138 KB
-
Five Antiderivatives of exp(xx+1div(xx)).png 1,211 × 934; 118 KB
-
Fourier serie for my wikibook.png 640 × 384; 23 KB
-
Fourier serie in language c with gnuplot.png 640 × 384; 23 KB
-
Fractional Derivative-Weyl.gif 463 × 253; 1.49 MB
-
Fractional Derivatives-Euler.gif 480 × 265; 1.66 MB
-
Fractional Derivatives-RiemannLiouville.gif 473 × 270; 1.05 MB
-
Christoph Bernhard Francke - Bildnis des Philosophen Leibniz (ca. 1695) (cropped).jpg 2,421 × 2,628; 1.49 MB
-
Christoph Bernhard Francke - Bildnis des Philosophen Leibniz (ca. 1695) (cropped)2.jpg 1,514 × 1,912; 786 KB
-
Christoph Bernhard Francke - Bildnis des Philosophen Leibniz (ca. 1695).jpg 4,486 × 5,538; 4.22 MB
-
Gottfried Wilhelm von Leibniz.jpg 316 × 400; 38 KB
-
FTC geometric2.png 2,000 × 1,155; 123 KB
-
Fundamental Theorem of Calculus.svg 117 × 30; 13 KB
-
Funksjonsdrofting fortegnsskjema.png 719 × 327; 8 KB
-
Funktionvariante2.svg 165 × 165; 484 KB
-
Gottfried Wilhelm Leibniz, Bernhard Christoph Francke.jpg 4,486 × 5,538; 11.2 MB
-
Graph of sin(x^-1).svg 600 × 480; 18 KB
-
Graph of x^-2.svg 600 × 480; 11 KB
-
Graphing Exercise of L'hôpital's Rule.svg 512 × 384; 40 KB
-
Heaviside function with gnuplot and C language.png 640 × 384; 8 KB
-
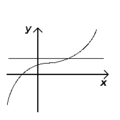
Horizontal-test-ok.png 200 × 200; 557 bytes
-
Hyperbolic Paraboloid.png 1,376 × 864; 145 KB
-
If a curve C has a smooth parametrization 01.png 640 × 384; 20 KB
-
If a curve C has a smooth parametrization 02.png 640 × 384; 20 KB
-
Ijk-coordinate-system.png 920 × 946; 123 KB
-
Illustration To Derivation Of Asymptotic For Saddle Point Integration.pdf 1,125 × 1,500; 3.91 MB
-
Infinitesimal Calculus 1.png 401 × 274; 3 KB
-
Infinitesimal Calculus 10.png 384 × 330; 2 KB
-
Infinitesimal Calculus 2.png 396 × 235; 1 KB
-
Infinitesimal Calculus 3.png 502 × 247; 2 KB
-
Infinitesimal Calculus 5.png 269 × 283; 3 KB
-
Infinitesimal Calculus 6.png 336 × 247; 2 KB
-
Infinitesimal Calculus 7.png 373 × 228; 2 KB
-
Infinitesimal Calculus 8.png 543 × 438; 3 KB
-
Infinitesimal Calculus 9.png 369 × 227; 1 KB
-
Infinitesimal-Calculus-4.png 456 × 238; 2 KB
-
Integral and derivative.svg 371 × 126; 8 KB
-
Integration of ln x.svg 1,564 × 1,923; 45 KB
-
Interseção de cos(2 pi x) e 1.svg 429 × 235; 95 KB
-
IntervallschachtellungWurzel2.svg 637 × 227; 36 KB
-
Inv-Fun-Thm-1.png 783 × 728; 11 KB
-
Inv-Fun-Thm-2.png 783 × 728; 11 KB
-
Inv-Fun-Thm-3.png 783 × 728; 10 KB
-
Involutes of a cubic curve.svg 1,440 × 1,440; 59 KB
-
Kinematics.svg 524 × 317; 32 KB
-
Leibniz sector formula.svg 314 × 305; 49 KB
-
LeibnizNotation.png 354 × 202; 15 KB
-
Limit L Hopital.svg 284 × 50; 8 KB
-
Limite f(x,y) Formes indéterminées A00.png 640 × 480; 119 KB
-
Limite f(x,y) Formes indéterminées A01.png 640 × 480; 114 KB
-
Limite f(x,y) Formes indéterminées A02.png 640 × 480; 119 KB
-
Limite f(x,y) Formes indéterminées A03.png 640 × 480; 143 KB
-
Limiting subdifferential.png 991 × 986; 140 KB
-
Log epsilon algo.svg 999 × 652; 45 KB
-
MaFonction.png 357 × 242; 8 KB
-
Mathnote894462.jpg 3,264 × 1,836; 1.48 MB
-
Maximizing revenue.png 3,000 × 2,190; 266 KB
-
My spherical coordinates.png 1,407 × 1,138; 64 KB
-
Màxims i mínims d'una funció.PNG 477 × 519; 25 KB
-
Newton'smethod 01.png 640 × 480; 28 KB
-
Newton'smethod 02.png 640 × 480; 25 KB
-
Newton'smethod 03.png 640 × 480; 22 KB
-
Oneven functie.PNG 346 × 340; 5 KB
-
Optimization Problem 2.jpg 959 × 699; 85 KB
-
Optimization Problem.jpg 960 × 720; 40 KB
-
Parallelogram of forces - ball on slope.pdf 1,754 × 814; 11 KB
-
Pendiente.png 356 × 212; 2 KB
-
Physics intersection.png 570 × 530; 24 KB
-
Picturing the Law.jpg 537 × 436; 36 KB
-
Pm1234 Abel.svg 197 × 477; 943 KB
-
Problem.jpg 150 × 150; 5 KB
-
ProprietateaDarboux.jpg 1,040 × 1,040; 59 KB
-
Pseudovector-222.png 705 × 727; 70 KB
-
Pure-mathematics-formulæ-blackboard.jpg 1,600 × 1,200; 167 KB
-
Pythagmamikon.gif 186 × 198; 12 KB
-
Riemann sum simple functions.svg 261 × 116; 40 KB
-
Riemann Sum.gif 1,075 × 359; 4.46 MB
-
RP HW 1 1 1.png 2,592 × 3,242; 119 KB
-
RP HW 1 1 2.png 2,592 × 3,242; 89 KB
-
RP HW 1 1 3.png 2,592 × 3,242; 45 KB
-
RP HW 1 1 4.png 2,592 × 3,242; 50 KB
-
RP HW 1 1 5.png 2,592 × 3,242; 48 KB
-
RP HW 1 2 1.png 2,592 × 3,242; 97 KB
-
RP HW 1 3 1.png 2,592 × 3,242; 117 KB
-
RP HW 1 3 2.png 2,592 × 3,242; 96 KB
-
RP HW 1 3 3.png 2,592 × 3,242; 72 KB
-
RP HW 1 3 4.png 2,592 × 3,242; 56 KB
-
RP HW 1 7 1.png 2,592 × 3,242; 117 KB
-
Rustove funkce.png 615 × 497; 47 KB
-
ScriptPente.png 431 × 304; 10 KB
-
Senkrechte Tangente.svg 3,020 × 2,120; 94 KB
-
Set sequence nonconverging.svg 478 × 214; 28 KB
-
ShadowProblem.svg 252 × 513; 121 KB
-
Smoothmax.png 640 × 384; 28 KB
-
Spirale animation m10 p10.gif 1,048 × 834; 9.61 MB
-
Strength and Yield Forming The Infinitely Rotary Source of Power.png 1,225 × 340; 32 KB
-
Tangent Line Approximation.svg 414 × 405; 22 KB
-
The area A of the region bounded by the graphs of r = 2*cos(t).png 640 × 384; 49 KB
-
The area A of the region bounded by the graphs of r = exp(t).png 640 × 384; 41 KB
-
The center of mass of the lamina 01.png 640 × 384; 15 KB
-
The center of mass of the lamina 02.png 640 × 384; 18 KB
-
The center of mass of the lamina 03.png 640 × 384; 16 KB
-
The Method of Fluxions (1730) Plate 6.jpg 1,219 × 828; 140 KB
-
Theorems in differential calculus.png 5,258 × 7,835; 8.01 MB
-
Theorems in differential calculus.svg 1,683 × 2,507; 8.38 MB
-
Todiste100.png 787 × 559; 37 KB
-
Todiste101.png 817 × 634; 55 KB
-
Todiste31.png 604 × 340; 11 KB
-
Todiste64.png 1,078 × 560; 19 KB
-
Translation droite 1.JPG 397 × 425; 9 KB
-
Two polar equations r = f(t) and r = g(t) 01.png 640 × 384; 50 KB
-
Two polar equations r = f(t) and r = g(t) 02.png 640 × 384; 57 KB
-
Twoquestionsolution.png 557 × 296; 15 KB
-
Vlindercurve transcendent.jpg 950 × 691; 130 KB
-
Wag-133-Exercises-1 Projectile Trajectories.png 350 × 215; 33 KB
-
Year 11 2U Limits and Continuity.pdf 754 × 566, 14 pages; 425 KB
-
Εμβαδική Ταχύτητα.png 561 × 363; 12 KB
-
Дивергенция.jpg 450 × 380; 25 KB


