Category:Biological diagrams in German
Jump to navigation
Jump to search
Subcategories
This category has the following 2 subcategories, out of 2 total.
D
M
Media in category "Biological diagrams in German"
The following 39 files are in this category, out of 39 total.
-
Aufteilung eines Baums in Baumkrone Stamm und Wurzel.jpg 368 × 348; 22 KB
-
Bestandteile des Apfels 01 (fcm).jpg 2,554 × 1,763; 1.18 MB
-
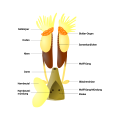
Bufonidae male reproductive system de.svg 1,000 × 1,000; 68 KB
-
Chromosom Chromatide Feinstruktur.png 485 × 529; 37 KB
-
Die Keimbahn.png 1,240 × 786; 79 KB
-
Endosymbiontentheorie.png 1,861 × 1,033; 844 KB
-
Escola Secundária Sá de Miranda, Braga (2).jpg 3,648 × 5,472; 5.89 MB
-
Escola Secundária Sá de Miranda, Braga (3).jpg 3,648 × 5,472; 6.25 MB
-
Escola Secundária Sá de Miranda, Braga (4).jpg 3,648 × 5,472; 5.82 MB
-
Evolutionäre spezifizierung von zellen zu nervenz.jpg 651 × 222; 29 KB
-
Extremitätenevolution.jpg 720 × 540; 56 KB
-
Freiburg Br. 2012-09-06 (19).JPG 3,648 × 2,736; 4.23 MB
-
Höhenstufen der anden.png 802 × 881; 107 KB
-
ImmunfluoreszenzI.jpg 400 × 482; 19 KB
-
LPCC-831-Cartell sobre blat de moro híbrid.jpg 1,758 × 1,122; 281 KB
-
McCree-Kurve 1 DE.svg 815 × 505; 16 KB
-
McCree-Kurve 3 Rot-Grün-Blau-LEDs DE.svg 615 × 380; 108 KB
-
McCree-Kurve Beschattung durch Weizen DE.svg 615 × 380; 110 KB
-
McCree-Kurve Hoover 1937 DE.svg 815 × 505; 13 KB
-
McCree-Kurve Inada 1976 DE.svg 815 × 505; 14 KB
-
McCree-Kurve Keramik-Metallhalogenid-Lampe DE.svg 615 × 380; 122 KB
-
McCree-Kurve Quarz-Halogen-Lampe DE.svg 615 × 380; 107 KB
-
McCree-Kurve Sonnenlicht klar DE.svg 815 × 505; 23 KB
-
Nahrungsbeziehung im See.jpg 3,507 × 2,550; 2.02 MB
-
Nahrungsbeziehungen im Meer.jpg 3,508 × 2,480; 1.08 MB
-
Nahrungskette in einem See.jpg 3,507 × 2,550; 1.83 MB
-
Nahrungspyramide2.jpg 3,508 × 2,480; 1.23 MB
-
Nahrungspyramide3.jpg 2,550 × 3,507; 783 KB
-
Nahrungspyramide4.jpg 3,508 × 2,480; 964 KB
-
Neuralleiste Migration der Zellen.png 1,638 × 1,350; 337 KB
-
Photosynthese3.jpg 2,550 × 3,507; 704 KB
-
Populationen.jpg 3,508 × 2,480; 1.69 MB
-
T cell activation-Deutsch.png 686 × 1,038; 113 KB
-
Tierzüchtung.jpg 3,508 × 2,480; 769 KB
-
Toleranzbereiche und Optimum.jpg 1,531 × 1,651; 164 KB
-
Vererbungslehre.jpg 3,508 × 2,480; 1.24 MB
-
Vererbungsregeln.jpg 3,508 × 2,480; 893 KB
-
Wirbeltierextremität.png 2,162 × 992; 59 KB
-
ZapfenEvolution.png 1,134 × 405; 148 KB


