Category:Bioinformatics
Jump to navigation
Jump to search
English: Bioinformatics is the application of computer science and information technology to the field of biology and medicine. Bioinformatics deals with algorithms, databases and information systems, web technologies, artificial intelligence and soft computing, information and computation theory, software engineering, data mining, image processing, modeling and simulation, signal processing, discrete mathematics, control and system theory, circuit theory, and statistics, for generating new knowledge of biology and medicine, and improving & discovering new models of computation (e.g. DNA computing, neural computing, evolutionary computing, immuno-computing, swarm-computing, cellular-computing). Bioinformatics and Computational biology are interdisciplinary fields of research, development and application of algorithms, computational and statistical methods for management and analysis of biological data, and for solving basic biological problems.
computational analysis of large, complex sets of biological data | |||||
| Upload media | |||||
| Spoken text audio | |||||
|---|---|---|---|---|---|
| Pronunciation audio | |||||
| Instance of | |||||
| Subclass of | |||||
| Part of | |||||
| Different from | |||||
| |||||
Subcategories
This category has the following 54 subcategories, out of 54 total.
*
A
B
C
- Cardiovascular models (93 F)
- Cytoscape (33 F)
D
E
- Evolutionary modeling (77 F)
- Exscalate4Cov (2 F)
I
- Infectious disease modeling (69 F)
L
- Carolyn Lawrence-Dill (2 F)
M
O
P
- Pathway analysis (5 F)
- Precision and recall (12 F)
S
- Semantic integration (7 F)
V
Media in category "Bioinformatics"
The following 200 files are in this category, out of 409 total.
(previous page) (next page)-
028-ISMB15-Fellows2015 (20850934719).jpg 1,800 × 1,200; 753 KB
-
2-way-relation-with-arrow.png 3,281 × 605; 99 KB
-
2LZM.png 2,000 × 1,748; 1.25 MB
-
3'-UTR Secondary Structure of C1orf68.pdf 1,950 × 2,550; 442 KB
-
3-way-ERD.svg 411 × 141; 3 KB
-
4273pi background image.png 1,920 × 1,200; 489 KB
-
Aars alignment.png 5,262 × 2,771; 3.87 MB
-
ACBP MSM from Folding@home.tiff 3,036 × 1,817; 1.1 MB
-
ACGH profile of the IMR32 neuroblastoma cell line.svg 407 × 214; 4.07 MB
-
Acr protein in host cell.jpg 2,079 × 832; 137 KB
-
Acr protein structure.jpg 1,021 × 1,512; 240 KB
-
Additive distance matrix.png 861 × 400; 64 KB
-
Adv-D26 7-24-2021 1 ps.tif 10,042 × 8,063; 231.68 MB
-
Algorithm1 add kmer to forest.png 874 × 397; 17 KB
-
Algorithm2 build k-mer forest.png 887 × 226; 9 KB
-
Analyze of Genome.jpg 2,720 × 2,444; 1.05 MB
-
Applications of anti-CRISPR.jpg 2,154 × 1,587; 281 KB
-
Archs4 C2Orf72 Lipid July 16 2022.png 987 × 761; 60 KB
-
Array-CGH protocol.svg 993 × 531; 2.51 MB
-
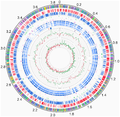
Arthrobacter arilaitensis Re117 genome.png 1,767 × 1,728; 3.42 MB
-
AutomatedFlowPipeline.svg 612 × 459; 238 KB
-
BacillusPhageSplitstree.png 624 × 448; 22 KB
-
BacillusSubSpecies.png 767 × 506; 201 KB
-
Bacteriophage Lambda.tif 6,814 × 8,063; 8.11 MB
-
Bacteriophage T5 Structural Model at Atomic Resolution.tif 6,153 × 11,237; 13.74 MB
-
Bacteriophage T7 Structural Model at Atomic Resolution.tif 2,857 × 3,129; 6.21 MB
-
Basic Procedure of Genomic Data Compression.jpg 1,630 × 549; 1,016 KB
-
Bifurcation.jpg 173 × 136; 10 KB
-
Binary BCF versus VCF format.png 1,340 × 542; 285 KB
-
Bio informatics.png 602 × 368; 180 KB
-
BiocondactorPlot.png 918 × 341; 48 KB
-
Bioconductors packs plot.png 14,173 × 9,448; 1.29 MB
-
Biocuration in PubMed until 2020.png 1,218 × 740; 30 KB
-
Bioinformatic Analysis of Inherited Templates (BAIT) Output.png 1,070 × 638; 64 KB
-
Bioinformatics icon.png 128 × 128; 15 KB
-
Bioinformatics workflow to analyse high-throughput experiments.png 805 × 1,050; 120 KB
-
Bioinformatics workflow to analyse high-throughput experiments.svg 322 × 420; 185 KB
-
Bioinformatics-model.jpg 832 × 574; 71 KB
-
Biological Target Prediction of Bioactive Molecules Based on Minimum Structures Identification.pdf 17,833 × 12,614; 1.31 MB
-
Blosum62-dayhoff-ordering.svg 1,550 × 1,096; 421 KB
-
C10orf53 Orthologs by taxa.png 1,600 × 706; 556 KB
-
C12orf42 protein cartoon.png 626 × 165; 8 KB
-
C16orf95 protein secondary structure prediction.png 466 × 212; 33 KB
-
C1orf112 Location.png 1,062 × 214; 23 KB
-
C1orf68 Repeat Sequence Conservation LOGO.png 382 × 109; 20 KB
-
C2Orf72 AlphaFold July 16 2022 AF-A6NCS6-F1.png 1,181 × 2,105; 520 KB
-
C2orf72 locus, 2q37.1.png 116 × 894; 20 KB
-
C2orf72 Molecular Clock Method, Evolutionary Rate Analysis.png 893 × 605; 46 KB
-
C2orf72 Ortholog Space Wiki Image.png 1,667 × 1,109; 146 KB
-
C2orf72 Orthologs List.png 807 × 616; 305 KB
-
C2Orf72 Schematic July 16 2022.png 942 × 431; 49 KB
-
C5orf24 Conceptual Translation.jpg 813 × 758; 147 KB
-
C674115.jpg 1,280 × 1,160; 110 KB
-
Calidad Phred 33.png 1,245 × 843; 138 KB
-
Cargas Parciais dos Aminoácidos ALA-SER.png 1,730 × 1,184; 284 KB
-
Case 1.png 319 × 124; 6 KB
-
Case2.png 304 × 122; 6 KB
-
Case3.png 309 × 122; 6 KB
-
Case4.png 264 × 132; 6 KB
-
Chapter1Fig1.png 858 × 941; 271 KB
-
Cheshift-2 screenshot.png 621 × 426; 57 KB
-
ChIP-on-chip profile.svg 407 × 187; 235 KB
-
ChIP-on-chip protocol.svg 397 × 421; 1.2 MB
-
ChIP-on-chip workflow overview-ru.svg 1,049 × 559; 20 KB
-
ChIP-on-chip workflow overview.svg 1,049 × 559; 6 KB
-
Chou's PseAAC illustration.jpg 1,902 × 1,218; 315 KB
-
Chromatin immunoprecipitation sequencing(ru).png 2,000 × 4,515; 1.8 MB
-
Chromatin study history.png 1,917 × 392; 129 KB
-
CicleSAM2.svg 512 × 411; 41 KB
-
Clade in Phylogenetic Tree.png 1,182 × 617; 23 KB
-
CLIQS 1D Pro pulsed-field gel electrophoresis fingerprinting software.png 2,552 × 1,279; 1.08 MB
-
Closest-string problem example svg.svg 374 × 224; 20 KB
-
Closest-string problem example.pdf 620 × 372; 11 KB
-
Clustal (Chenna, 2003) 1.jpg 602 × 389; 44 KB
-
Clustal (Chenna, 2003) 2.jpg 602 × 462; 35 KB
-
Clustal (Thompson, 1994).jpg 651 × 916; 94 KB
-
Coilll.png 535 × 535; 17 KB
-
Compaction.png 526 × 523; 23 KB
-
Comparação de sintenia entre genomas.png 1,153 × 292; 105 KB
-
Comparison of Gap Penalty Funcitons.png 640 × 480; 6 KB
-
Conceptual Translation of Bottom Portion of Human Protein Tex44.jpg 2,244 × 2,904; 344 KB
-
Conceptual Translation of Upper Portion of Human Protein Tex44.jpg 2,244 × 2,904; 663 KB
-
Constant gap penalty.jpg 221 × 119; 14 KB
-
Correlated mutation.png 2,011 × 807; 174 KB
-
Correlated Mutations Method.png 912 × 932; 574 KB
-
Correlation plots of double knockout distribution across subsystems in M.tb and E.coli.png 2,311 × 1,083; 1,014 KB
-
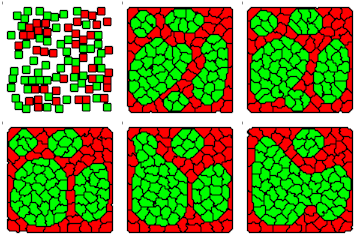
CPM Cell Sorting.gif 160 × 160; 4.05 MB
-
Cs5634-2-way-takes-rel-key.png 719 × 307; 8 KB
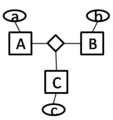
-
Cs5634-3-way-ABC-key-noarrow.png 255 × 271; 4 KB
-
Csacascasc.jpg 1,250 × 1,226; 1.64 MB
-
D3GBinfo.png 1,000 × 500; 96 KB
-
DART method.jpg 384 × 394; 20 KB
-
DCJ Example Genome.png 1,052 × 512; 44 KB
-
De-bruijn-dna-assembly.png 1,536 × 2,048; 303 KB
-
Decomposition of a de Bruijn graph of MetaVelvet.pdf 1,039 × 1,081; 95 KB
-
DeepInsight method to transform non-image data to 2D image for convolutional neural network architecture.pdf 1,239 × 1,629, 7 pages; 1.78 MB
-
Developments in next generation sequencing.jpg 720 × 540; 61 KB
-
Digital Transcriptome Sequencing.jpg 3,333 × 2,500; 2.25 MB
-
Disease Gene Mapping with Multiple Chromosomes.jpg 2,207 × 2,689; 838 KB
-
Distribución de los metabolitos en el NP-Atlas.png 4,309 × 2,413; 1.51 MB
-
DNA flow chart.png 1,760 × 1,360; 56 KB
-
Docking.png 500 × 158; 9 KB
-
Domain Homology.png 929 × 435; 142 KB
-
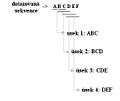
Dotazovana sekvence.jpg 297 × 249; 16 KB
-
DTSpiechart.png 2,621 × 1,055; 795 KB
-
Ehtemalat pishro.jpg 412 × 324; 49 KB
-
Empilhamento aromático.png 1,765 × 1,111; 641 KB
-
En-Bioinformatics.ogg 37 min 0 s; 17.91 MB
-
En-uk-bioinformatical.ogg 1.6 s; 25 KB
-
En-us-bioinformatics.ogg 2.4 s; 37 KB
-
Ensembl release109 mb screenshot.png 1,102 × 862; 158 KB
-
Erill 2011 EBM Conference Researchsome.png 3,000 × 2,250; 190 KB
-
Estruturas de proteínas.png 1,063 × 275; 95 KB
-
EvoMining.png 6,742 × 3,322; 1.93 MB
-
Example 1seq.pdf 3,797 × 2,958; 77 KB
-
Example 2simp.pdf 2,829 × 1,077; 13 KB
-
Example 3.pdf 2,829 × 1,077; 14 KB
-
Example 4.pdf 2,225 × 252; 8 KB
-
Example 5.pdf 2,652 × 1,054; 17 KB
-
Exorf-1V3.png 1,232 × 750; 32 KB
-
Exorf-2V2.png 1,274 × 832; 36 KB
-
FAM208b.GeneNeighborhood.png 945 × 156; 20 KB
-
FANTOM History v2 Draft.jpg 600 × 697; 231 KB
-
Farmakofory.png 1,036 × 207; 54 KB
-
FBA O2 Exchange perturbation of Ec iAF1260 flux1.png 545 × 558; 15 KB
-
Figure 2 (8265887778).png 604 × 817; 494 KB
-
Figure1 interactome highres.tif 1,716 × 1,256; 1.04 MB
-
Final DNA flow chart.png 1,760 × 1,360; 17 KB
-
Final Sample DNA flow chart.png 710 × 240; 18 KB
-
First and second infection by phages.jpg 3,591 × 2,268; 551 KB
-
Five Stages of Molecular Phylogenetic Analysis.png 1,964 × 218; 43 KB
-
FLJ and ADCY ExORF.png 1,128 × 1,892; 134 KB
-
Foldit 1236616893.png 1,086 × 693; 356 KB
-
Formato-fastq.svg 1,292 × 611; 126 KB
-
Fragment of Sus scrofa microtubule stabilized with taxol and peloruside.jpg 9,171 × 9,196; 8.24 MB
-
Freqüència esperada.png 539 × 184; 25 KB
-
Freqüència Observada.png 539 × 186; 21 KB
-
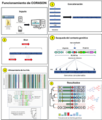
Funcionamiento de CORASON.png 5,181 × 6,094; 8.12 MB
-
Funrich.jpg 1,113 × 739; 141 KB
-
GAM Detection Frequency.png 518 × 496; 22 KB
-
GATC.JPG 1,536 × 2,048; 1.2 MB
-
GBIF network as of 29 Aug 2017.png 1,442 × 720; 324 KB
-
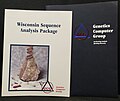
GCGPackageManual.jpg 360 × 304; 91 KB
-
Gene 1700113H08Rik.png 424 × 443; 175 KB
-
Gene co-expression network construction steps.png 1,140 × 733; 157 KB
-
Gene co-expression network with 7221 genes for 18 gastric cancer patients.png 1,010 × 573; 538 KB
-
Gene co-expression vs regulation.png 389 × 343; 13 KB
-
Gene Expression - Homo sapien Adults.png 855 × 500; 68 KB
-
Gene expression matrix.jpg 5,387 × 3,243; 5.99 MB
-
Gene Fusion Types.png 576 × 525; 86 KB
-
Gene Neighborhood Conservation Method.png 884 × 524; 263 KB
-
GENE1.png 769 × 433; 35 KB
-
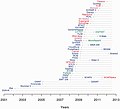
Genome Annotation Timeline.svg 635 × 244; 217 KB
-
Genome Assembly Statistics.png 6,640 × 2,888; 219 KB
-
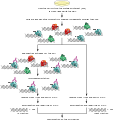
Genome sequencing project flowchart.svg 460 × 461; 7 KB
-
Genome size vs number of genes.svg 1,350 × 900; 1.74 MB
-
Genome size vs protein count.svg 512 × 512; 11.02 MB
-
Genome sizes.png 2,062 × 2,338; 250 KB
-
Genome skimming workflow.png 951 × 1,043; 71 KB
-
Genome-analysis-pipeline.png 2,880 × 774; 130 KB
-
Genotyping By Sequencing.png 679 × 99; 7 KB
-
GNU Health disease genes summary.png 1,514 × 1,099; 273 KB
-
Gnu health protein variant phenotype.png 1,522 × 854; 172 KB
-
GNU Health showing BRCA1 natural variants phenotypes.png 1,917 × 1,040; 815 KB
-
Gnu Health UniProt protein related diseases.png 1,417 × 1,011; 220 KB
-
Heatmap RNAseqV2 1.png 861 × 553; 16 KB
-
Historic cost of sequencing a human genome.svg 1,200 × 800; 22 KB
-
HIVE Annotation Mapper Computation.png 927 × 885; 130 KB
-
HIVE Heptagon Computation.png 1,034 × 1,161; 252 KB
-
HIVE Heptagon Web Interface Portal with Advanced Parameters.png 1,212 × 940; 151 KB
-
HIVE Heptagon Web Interface Portal.png 1,212 × 661; 130 KB
-
HIVE Hexagon Computation.png 1,015 × 850; 185 KB
-
HIVE Hexagon Web Interface Portal with Advanced Parameters.png 1,084 × 942; 191 KB
-
HIVE Hexagon Web Interface Portal.png 1,054 × 493; 138 KB
-
HIVE Hexahedron Computation.png 969 × 1,053; 221 KB
-
HIVE IDBA-UD Computation.png 1,102 × 885; 151 KB
-
HIVE MAFFT Computation.png 1,075 × 728; 174 KB
-
HIVE Velvet Computation.png 1,102 × 696; 121 KB
-
HIVE-hardware.png 1,495 × 1,332; 614 KB
-
HIVE-software.png 1,127 × 710; 187 KB
-
HIVE-visualizations.png 1,051 × 829; 926 KB
-
Homologs.png 376 × 364; 402 KB
-
HPA RNA-Seq normal tissues C2Orf72 Expression Profile July 16 2022.png 2,241 × 840; 60 KB
-
Human C1orf68 Conceptual Translation.png 556 × 628; 114 KB
-
Human C1orf68 Promoter GXP 1818199 (480 bp section).png 632 × 663; 85 KB
-
Human C1orf68 Promoter GXP 1818199 diagram.png 714 × 68; 19 KB
-
Human C1orf68 Protein Domains.png 1,000 × 800; 12 KB
-
Human FAM153A Orthologs.jpg 2,206 × 568; 323 KB
-
Human FAM153A Paralogs.jpg 2,300 × 268; 162 KB
-
Human genome assembly GRCh38 chromosomes ideogram NCBI.png 1,575 × 568; 181 KB
-
Human ZFP62 Protein Interactions, as Compiled by the STRING Database..jpg 1,582 × 762; 289 KB
-
Hydrogen bond (angle).png 1,972 × 1,455; 262 KB
-
HypotheticalInterologExample.png 530 × 755; 37 KB


