Category:Animated maps about the COVID-19 pandemic
Jump to navigation
Jump to search
Media in category "Animated maps about the COVID-19 pandemic"
The following 56 files are in this category, out of 56 total.
-
Confirmed cases of COVID-19 in Ireland by county.webm 51 s, 1,472 × 1,600; 847 KB
-
Confirmed cases of COVID-19 per 100k inhabitants in Ireland.webm 51 s, 1,472 × 1,600; 705 KB
-
Corona Outbreak Germany Animation.gif 608 × 805; 2.49 MB
-
Coronavirus Outbreak in South Korea over Time.gif 412 × 830; 17.38 MB
-
Covid map mandaue missing.gif 1,000 × 1,000; 210 KB
-
COVID-19 Austria 7-day prevalence per capita (districts timeline).webm 1 min 53 s, 1,500 × 802; 3.02 MB
-
COVID-19 Austria cases per capita (districts timeline).webm 1 min 1 s, 1,000 × 534; 787 KB
-
COVID-19 Confirmed Cases Animated Map of China.gif 800 × 680; 429 KB
-
COVID-19 Confirmed Cases Animated Map Thumb.gif 300 × 255; 1.03 MB
-
COVID-19 Confirmed Cases Animated Map.gif 800 × 680; 5.23 MB
-
COVID-19 coronavirus pandemic in Asia.gif 878 × 584; 692 KB
-
COVID-19 Czech Republic 7-day prevalence per capita (timeline).webm 1 min 52 s, 1,020 × 597; 2.2 MB
-
COVID-19 Euskal Herria hildakoak.gif 712 × 568; 568 KB
-
COVID-19 Germany 7-day prevalence per capita (timeline).webm 1 min 54 s, 921 × 921; 3.22 MB
-
COVID-19 growth from 03-18-2020 to 03-25-2020.gif 1,200 × 797; 566 KB
-
COVID-19 growth from 03-18-2020 to 03-26-2020.gif 1,200 × 797; 707 KB
-
COVID-19 growth from 03-18-2020 to 03-28-2020.gif 1,200 × 797; 798 KB
-
COVID-19 India Total Cases Animated Map.gif 1,102 × 1,254; 2.7 MB
-
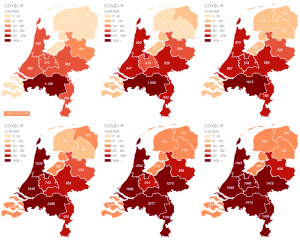
COVID-19 Netherlands - 7-day prevalence per capita (timeline).webm 1 min 46 s, 866 × 1,030; 3.22 MB
-
COVID-19 Outbreak Cases in Sumy Oblast, Ukraine (animation).gif 534 × 695; 289 KB
-
COVID-19 Outbreak Cases in Ukraine (animation).gif 600 × 404; 1.77 MB
-
COVID-19 Restrictions to Turkey gif.gif 800 × 406; 476 KB
-
COVID-19 Slovenia - 7-day prevalence per capita (timeline).webm 1 min 51 s, 1,385 × 775; 3.16 MB
-
COVID-19 spread in Germany (27 February to 22 March 2020).gif 947 × 1,253; 3.87 MB
-
Covid-19 spread timeline in Indonesia.gif 720 × 276; 3.44 MB
-
COVID-19-outbreak-timeline.gif 1,194 × 606; 587 KB
-
COVID-19-outbreak-timeline.webm 39 s, 1,194 × 606; 462 KB
-
COVID-19-pandemic-Poland-timeline.gif 711 × 689; 1.15 MB
-
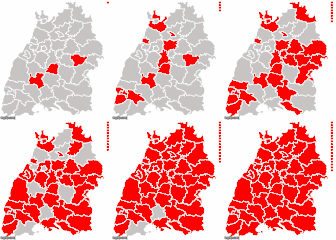
COVID-19-Spread-In-Baden-Württemberg-0227-0315.gif 432 × 463; 54 KB
-
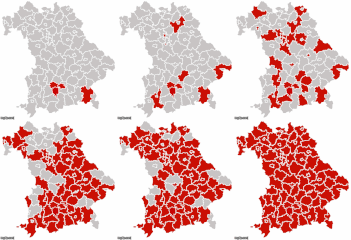
COVID-19-Spread-In-Bavaria.gif 487 × 500; 438 KB
-
COVID-19-Spread-in-Brandenburg-0301-0320.gif 500 × 400; 104 KB
-
COVID-19-Spread-In-Lower-Saxony.gif 500 × 447; 94 KB
-
COVID-19-Spread-In-Mecklenburg-Vorpommern-0301-0318.gif 470 × 381; 17 KB
-
COVID-19-Spread-In-North-Rhine-Westphalia-0223-0316.gif 500 × 469; 111 KB
-
CoVid19 New Jersey movie July 12.gif 800 × 715; 23.65 MB
-
Cumulative Cases Colored.gif 849 × 1,200; 4.39 MB
-
Evolución desescalada COVID-19 por provincias en España.gif 1,200 × 776; 252 KB
-
Jilin Province COVID-19 confirmed cases animated map.webm 1 min 3 s, 856 × 720; 1.32 MB
-
Kolkata-COVID19-containment-zones-WEsearch-lab.gif 1,200 × 1,201; 436 KB
-
Koronabirusa Euskal Herrian.gif 707 × 565; 602 KB
-
Koronavirus slovensko.gif 1,200 × 596; 6.53 MB
-
Ohio coronavirus gif.gif 507 × 556; 577 KB
-
Pt(covid.gif 600 × 1,500; 93 KB
-
Spread of COVID-19 Cases in Tennessee.gif 792 × 200; 1.32 MB
-
Spread of COVID-19 in the United States.gif 959 × 593; 1.74 MB
-
Spread of the Covid-19 pandemic in Africa.gif 640 × 400; 88 KB
-
Spread of the Covid-19 pandemic in America.gif 500 × 600; 382 KB
-
Spread of the Covid-19 pandemic in Europe.gif 1,200 × 1,002; 397 KB
-
Spread of the Covid-19 pandemic worldwide.gif 2,624 × 1,424; 3.12 MB
-
Weekly Active COVID-19 Cases in Davao City.gif 849 × 1,200; 4.25 MB
-
Weeklycumulativecases.gif 1,500 × 1,000; 1.33 MB


