Category:Agricultural maps of the United States
Jump to navigation
Jump to search
Subcategories
This category has the following 2 subcategories, out of 2 total.
Media in category "Agricultural maps of the United States"
The following 123 files are in this category, out of 123 total.
-
(FINAL) 11.10.15c Dairy Prop Symbol -Converted-.pdf 1,650 × 1,275; 1.23 MB
-
(FINAL) 11.10.15c Dairy Prop Symbol -Converted-.svg 1,100 × 769; 717 KB
-
1846 Emmons Agricultural Map of New York State - Geographicus - NewYork-emmons-1846.jpg 4,000 × 3,108; 3.34 MB
-
2007 Dairy Cows by State.svg 959 × 593; 90 KB
-
2007 Organic Acreage as a Percentage of Total State Farm Acreage.svg 959 × 593; 90 KB
-
2007 Organic Farm Acreage as a Percentage of State Area.svg 959 × 593; 90 KB
-
2007 Organic Farms (Dairy Cows per State Acre).svg 959 × 593; 90 KB
-
2007 Organic Farms as a Percentage of Total State Farms.svg 959 × 593; 90 KB
-
2007 State Organic Farm Acreage Per Person.svg 959 × 593; 90 KB
-
2007 United States Farm Acreage.svg 959 × 593; 90 KB
-
2007 United States Farms.svg 959 × 593; 90 KB
-
2007 United States Organic Farm Acreage.svg 959 × 593; 90 KB
-
2007 United States Organic Farms.svg 959 × 593; 90 KB
-
2008 crop damage insurance filings.jpg 560 × 367; 198 KB
-
2010 US rice production.svg 844 × 634; 1.74 MB
-
2019 Sorghum map US.pdf 1,500 × 1,125; 57 KB
-
2019 US map rice.pdf 1,500 × 1,125; 55 KB
-
2020aug-derecho-storm-crop-overlay-usda-map.png 705 × 545; 406 KB
-
2020aug-USDA-corn-condition-animated.gif 1,056 × 816; 214 KB
-
2020aug-USDA-soybean-condition-animated.gif 1,056 × 816; 214 KB
-
A map of the cotton kingdom and its dependencies in America (5490089850).jpg 2,000 × 1,362; 2.83 MB
-
Advanced Geography (1899) (14595149430).jpg 2,666 × 1,442; 1.16 MB
-
Advanced Geography (1899) (14758866716).jpg 2,220 × 1,400; 1.02 MB
-
AgriBank territory as of 2016-01-01.jpg 3,077 × 2,191; 1.3 MB
-
Agriculture US South 1860.jpg 802 × 582; 229 KB
-
AgStar territory as of 2016-09-25.jpg 1,203 × 867; 234 KB
-
Annual report (1901) (14750113865).jpg 3,712 × 2,565; 1.02 MB
-
Annual report (1901) (14750115395).jpg 3,648 × 2,514; 900 KB
-
Apple Maggot Quarantine Area.jpg 1,513 × 983; 204 KB
-
Arizona. Location of irrigated Land. 1949 - btv1b53200424w.jpg 8,626 × 10,148; 9.25 MB
-
Arkansas. Location of irrigated land - btv1b53200426s.jpg 7,874 × 7,234; 6.27 MB
-
Bell telephone magazine (1922) (14569798569).jpg 1,648 × 1,038; 342 KB
-
Bell telephone magazine (1922) (14756450095).jpg 1,640 × 1,054; 341 KB
-
Boll weevil eradication.jpg 955 × 717; 76 KB
-
Bulletin (20233790820).jpg 3,374 × 2,016; 786 KB
-
Bulletin of the U.S. Department of Agriculture (1913-1923.) (20311562620).jpg 4,375 × 2,895; 1.58 MB
-
Bulletin. 1901-13 (20434252311).jpg 3,634 × 2,460; 2.04 MB
-
California (Southern part) Location of irrigated Land, 1949 - btv1b53200425b (1 of 2).jpg 9,188 × 8,374; 8.27 MB
-
California (Southern part) Location of irrigated Land, 1949 - btv1b53200425b (2 of 2).jpg 11,855 × 8,579; 10.53 MB
-
Cattle railroad map.jpg 2,704 × 2,628; 834 KB
-
Corn Belt 2018.svg 990 × 765; 3.52 MB
-
Corn belt.svg 844 × 647; 2.71 MB
-
Corn.png 960 × 960; 254 KB
-
CornBelt.jpg 960 × 960; 188 KB
-
Cornbelt.png 960 × 960; 98 KB
-
Cotton belt.svg 959 × 593; 90 KB
-
Dairy farms, Seneca Creek Watershed, Montgomery County, Maryland LOC 82696025.jpg 3,376 × 2,619; 943 KB
-
Detasseling Map.png 1,256 × 1,011; 167 KB
-
Dicamba USA 2014.png 463 × 618; 219 KB
-
Dimethoate USA 2011.png 600 × 781; 202 KB
-
Dimethoate USA 2013.png 975 × 1,111; 47 KB
-
DistributionMap.png 816 × 1,056; 27 KB
-
FCB institution territories 2016-01-01.jpg 4,772 × 3,020; 5.75 MB
-
Flumioxazin USA 2013.png 920 × 1,130; 58 KB
-
General Distribution of Erosion - NARA - 140696184.jpg 19,520 × 12,940; 15.12 MB
-
Geographical phases of farm prices - corn (1918) (14781726501).jpg 2,748 × 1,740; 1.03 MB
-
Geographical phases of farm prices - corn (1918) (14784865105).jpg 2,656 × 1,792; 993 KB
-
Idaho Location of irrigated land - btv1b53200431z.jpg 7,138 × 11,803; 9 MB
-
Image taken from page 105 of 'Primary Geography. (With illustrations.)' (11226979715).jpg 2,017 × 2,070; 1.12 MB
-
Image taken from page 140 of 'Advanced Geography' (11253499574).jpg 2,391 × 1,548; 870 KB
-
Image taken from page 140 of 'Advanced Geography' (15968090484).jpg 1,455 × 981; 302 KB
-
Image taken from page 140 of 'Advanced Geography' (16564266336).jpg 942 × 996; 100 KB
-
Inseptisoller.jpg 2,896 × 2,783; 1.27 MB
-
Kansas Location of irrigated land, 50 miles (=81mm. ; 1 - 1 000 000 env) - btv1b53200430h.jpg 10,356 × 7,081; 7.55 MB
-
Lange diercke sachsen vereinigte staaten bodennutzung.jpg 969 × 1,054; 481 KB
-
LIDAR field yield.jpg 288 × 185; 110 KB
-
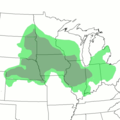
Map of USA highlighting Corn Belt.png 280 × 183; 41 KB
-
Map of USA highlighting Grain Belt.png 280 × 183; 40 KB
-
Montana. Location of irrigated Land - btv1b532004349.jpg 12,429 × 8,493; 12.91 MB
-
Nebraska. Location of irrigated Land - btv1b53200428p.jpg 9,712 × 6,912; 6.99 MB
-
Nevada. Location of irrigated Land. 1949 - btv1b532004277.jpg 8,175 × 10,957; 8.73 MB
-
NIE 1905 Cotton.jpg 2,485 × 1,562; 2.01 MB
-
NIE 1905 Maize.jpg 2,498 × 1,576; 1.71 MB
-
NIE 1905 Tobacco - production locations in the United States.jpg 2,480 × 1,562; 1.68 MB
-
NIE 1905 United States - Oats.jpg 2,475 × 1,559; 2.05 MB
-
NIE 1905 United States - Wheat.jpg 2,481 × 1,567; 2.24 MB
-
Oklahoma. Location of irrigated Land, 1949 - btv1b53200419q.jpg 9,846 × 6,693; 6.73 MB
-
Oregon Location of irrigated Land - btv1b53200435r.jpg 10,000 × 8,493; 9.53 MB
-
Paraquat USA 2013.png 909 × 1,108; 71 KB
-
Percent in agriculture - US.png 817 × 445; 56 KB
-
Proportion of land in agriculture by state 2012.png 5,100 × 3,300; 765 KB
-
Salt belt.svg 959 × 593; 90 KB
-
Salt-Belt.svg 1,000 × 589; 74 KB
-
Sheridan 6 ET.jpg 2,445 × 1,805; 1.45 MB
-
Sorghums - sure money crops (1914) (14593213908).jpg 2,944 × 1,892; 1.44 MB
-
South Dakota. Location of irrigated land. 1949 - btv1b532004203.jpg 9,853 × 6,550; 7.19 MB
-
Soybeans 2020 US map.pdf 1,650 × 1,275; 883 KB
-
Soybeans 2021 US map.pdf 1,500 × 1,125; 127 KB
-
Tobacco Production US.png 1,000 × 618; 109 KB
-
UMACRegion2.jpg 680 × 402; 63 KB
-
Usfrostbeltregions.PNG 800 × 525; 132 KB
-
Utah. Location of irrigated land, 1949 - btv1b53200423f.jpg 7,427 × 9,548; 7.63 MB
-
Washington. Location of irrigated Land. 1949 - btv1b53200421j.jpg 9,709 × 5,700; 6.91 MB
-
Willits farm map - DPLA - 901fb1578eecf96488f7ae17f68efd5e (page 1).jpg 8,270 × 9,000; 15.17 MB
-
Willits farm map - DPLA - 901fb1578eecf96488f7ae17f68efd5e (page 2).jpg 8,256 × 8,999; 13.01 MB
-
Willits farm map - DPLA - 901fb1578eecf96488f7ae17f68efd5e (page 3).jpg 8,256 × 8,999; 11.95 MB
-
Willits farm map - DPLA - 901fb1578eecf96488f7ae17f68efd5e (page 4).jpg 8,212 × 8,999; 13.72 MB
-
Willits farm map - DPLA - 901fb1578eecf96488f7ae17f68efd5e (page 5).jpg 8,257 × 9,000; 12.88 MB
-
Winter Wheat 2009 Planted by County.png 525 × 412; 196 KB
-
Wu-choroplethgw-2010.gif 893 × 534; 61 KB


