File:XYCoordinates.gif
XYCoordinates.gif (454 × 189 pixels, file size: 1.53 MB, MIME type: image/gif, looped, 49 frames, 6.7 s)
Captions
Captions
Summary
[edit]| DescriptionXYCoordinates.gif |
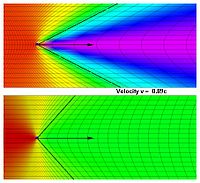
English: Demonstration of Aberration of light and Relativistic Doppler effect. In this diagram, the blue point represents the observer. The x,y-plane is represented by yellow graph paper. As the observer accelerates, he sees the graph paper change colors. Also he sees the distortion of the x,y-grid due to the aberration of light. The black vertical line is the y-axis. The observer accelerates along the x-axis.
|
| Source |
|
| Author | TxAlien at English Wikipedia |
How these images were made
[edit]
Animation: Image:Lcprojection2m.gif
In this section we will use the Minkowski space 4-dimension vectors and units where speed of light c = 1. In this notation velocity vector is
where
is a 3D velocity vector and
The component 

In spacetime, any small object is the sequence of spacetime events or world lines. Hence a 3D object in space-time can be described as a set of world lines corresponding to all the points that make up that object. Consider a simple objects in the space such as a sphere:

where a and b are parameters of the mapping and r is the radius of the sphere. To make the formulas easy to read we will leave out the parameters (a,b). In the frame where the object is at rest, the set of world lines can be represented as the world surface in Minkowski space
or
where 

it can be written as
At any given observer time
the surface in 3-d space after substitution
and
can be written as
However, observer can only see the object on light cone in the past when light is emitted by points on the object. Therefore, if observers coordinates are (t,0,0,0) he sees (Diagram 1) the surface points where they were in time
or in our notation
Solution to this equation is
Hence the observer will see the surface
where
On Diagram 2 surface 

It's still not finished--TxAlien 05:04, 3 September 2006 (UTC)
Other images
[edit] Animation: Media:Waves01.gif |
 Animation: Media:Compare03s.gif |
Next pictures show a model of movement through a subway tunnel at an increasing speed. Observer would not only see changes in colors but the outer walls will also appear convex. This convex appearance is due to seeing parts of the tunnel at different moments in time because of the finite speed of light. This effect is called aberration of light.
 Animation: Media:RelSubway2.gif |
 Animation: Media:RelSubway2.gif |
 |
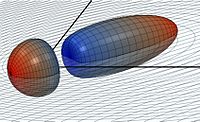
This images shows the view on a sphere moving at 0.7c relatively to a stationary observer, which is represented by blue point. Curved lines represent the xy grid coordinates of a moving system.
 Animation: Media:SphereAberration01.gif |
 Animation: Media:SphereAberration01.gif |
 Animation: Media:SphereAberration01.gif |
 Animation: Image:Tachyon03.gif |
 |
All these images are graphical solutions of an accurate mathematical model which is based on the Lorentz transformation
Licensing
[edit]| This file is licensed under the Creative Commons Attribution-Share Alike 3.0 Unported license. Subject to disclaimers. | ||
| Attribution: TxAlien at the English-language Wikipedia | ||
| ||
| This licensing tag was added to this file as part of the GFDL licensing update.http://creativecommons.org/licenses/by-sa/3.0/CC BY-SA 3.0Creative Commons Attribution-Share Alike 3.0truetrue |

|
Permission is granted to copy, distribute and/or modify this document under the terms of the GNU Free Documentation License, Version 1.2 or any later version published by the Free Software Foundation; with no Invariant Sections, no Front-Cover Texts, and no Back-Cover Texts. A copy of the license is included in the section entitled GNU Free Documentation License. Subject to disclaimers.http://www.gnu.org/copyleft/fdl.htmlGFDLGNU Free Documentation Licensetruetrue |
Original upload log
[edit]- 2006-08-12 23:50 TxAlien 454×189× (1600354 bytes) Demonstration of light aberration and [[Relativistic Doppler effect]].
File history
Click on a date/time to view the file as it appeared at that time.
| Date/Time | Thumbnail | Dimensions | User | Comment | |
|---|---|---|---|---|---|
| current | 21:28, 15 January 2012 |  | 454 × 189 (1.53 MB) | Cantons-de-l'Est (talk | contribs) | {{Information |Description={{en|Demonstration of en:Aberration of light and en:Relativistic Doppler effect. In this diagram, the blue point represents the observer. The x,y-plane is represented by yellow graph paper. As the observer accelerate |
You cannot overwrite this file.
File usage on Commons
The following page uses this file:
File usage on other wikis
The following other wikis use this file:
- Usage on bs.wikipedia.org
- Usage on es.wikipedia.org
- Usage on fr.wikipedia.org
- Usage on pt.wikipedia.org
- Usage on tr.wikipedia.org


