File:US-fluoridation-1992-2006.png
From Wikimedia Commons, the free media repository
Jump to navigation
Jump to search

Size of this preview: 407 × 599 pixels. Other resolutions: 163 × 240 pixels | 510 × 751 pixels.
Original file (510 × 751 pixels, file size: 406 KB, MIME type: image/png)
File information
Structured data
Captions
Captions
Add a one-line explanation of what this file represents

|
This map image could be re-created using vector graphics as an SVG file. This has several advantages; see Commons:Media for cleanup for more information. If an SVG form of this image is available, please upload it and afterwards replace this template with
{{vector version available|new image name}}.
It is recommended to name the SVG file “US-fluoridation-1992-2006.svg”—then the template Vector version available (or Vva) does not need the new image name parameter. |
Summary
[edit]| DescriptionUS-fluoridation-1992-2006.png |
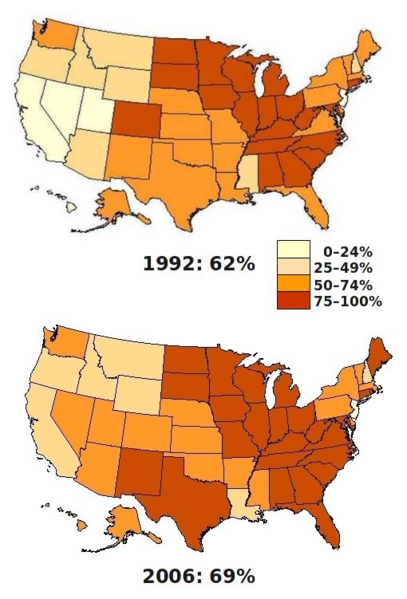
English: U.S. residents served with community water fluoridation, 1992 and 2006
The percentages are the proportions of the resident population served by public water supplies who are receiving water that is optimally fluoridated for the prevention of dental caries (cavities). The original commentary for this figure was "Water fluoridation has increased from 62% in 1992 to 69% in 2006, and a greater percentage of Americans are served by fluoridated water systems. Increase in bottled water consumption in recent years, however, may offset potential protection from fluoridated tap water." The figure also said that the 2010 target was 75%. |
| Date | |
| Source | https://www.cdc.gov/nchs/ppt/hpdata2010/focusareas/fa21_2.ppt |
| Author | Richard J. Klein, Acting Chief, Health Promotion Statistics Branch, National Center for Health Statistics, Centers for Disease Control and Prevention |
| Permission (Reusing this file) |
No known restrictions on publication. |
| Other versions | Image:US-fluoridation-1992-2006.jpeg |
Licensing
[edit]| Public domainPublic domainfalsefalse |
This file is a work of the Centers for Disease Control and Prevention, part of the United States Department of Health and Human Services, taken or made as part of an employee's official duties. As a work of the U.S. federal government, the file is in the public domain.
|
 |
File history
Click on a date/time to view the file as it appeared at that time.
| Date/Time | Thumbnail | Dimensions | User | Comment | |
|---|---|---|---|---|---|
| current | 15:21, 12 August 2010 |  | 510 × 751 (406 KB) | Beao (talk | contribs) | Transparent. |
| 00:39, 5 January 2009 |  | 510 × 751 (289 KB) | Eubulides (talk | contribs) | Use vertical alignment; better for wikipedia purposes. | |
| 19:35, 4 January 2009 |  | 1,007 × 499 (311 KB) | Eubulides (talk | contribs) | {{Information |Description={{en|1=U.S. residents served with community water fluoridation, 1992 and 2006 The percentages are the proportions of the resident population served by public water supplies who are receiving water that is optimally fluoridated |
You cannot overwrite this file.
File usage on Commons
The following page uses this file: