File:Pharmacokinetic model of drugs entering a tumor.svg
Jump to navigation
Jump to search

Size of this PNG preview of this SVG file: 512 × 341 pixels. Other resolutions: 320 × 213 pixels | 640 × 426 pixels | 1,024 × 682 pixels | 1,280 × 853 pixels | 2,560 × 1,705 pixels.
Original file (SVG file, nominally 512 × 341 pixels, file size: 214 KB)
Captions
Captions
Pharmacokinetic model of drugs entering a tumor
Summary
[edit]
| Description |
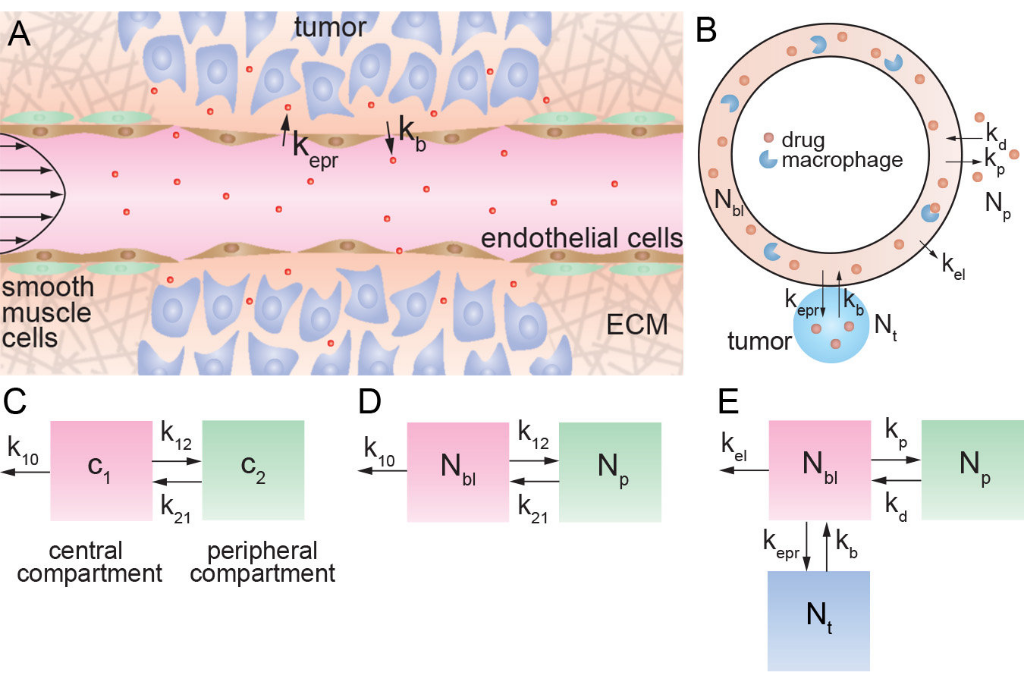
English: (A) Schematic illustration of a tumor vessel illustrating loss of smooth muscle cells, local degradation of the extracellular matrix, and increased permeability of the endothelium. (B) Illustration of the pharmacokinetic model taking into account the EPR effect. The rate constants kp and kd describe exchange with the peripheral volume. The rate constants kepr and kb describe extravasation from circulation into the tumor, and intravasation back into the circulation, respectively. The rate constant kel represents clearance by the kidneys, MPS, and any other non-tumor elimination processes, such that when kb = 0, k10 = kepr + kel where kel is the elimination rate constant. (C) Standard two compartment model with central and peripheral compartments. c1 and c2 represent the drug concentration in blood (central compartment) and normal tissue (peripheral compartment), respectively. The first order rate constant k10 describes all elimination pathways, including clearance by the kidneys, uptake by the MPS, and tumor accumulation. The first order rate constants k12 and k21 describe exchange between the two compartments. Note that kp = k12, kd = k21. (D) Two compartment model defined in terms of the drug amount, where Nbl is the amount of drug in blood (mg), and Np is the amount in peripheral tissue (mg). (E) Three compartment model with the addition of a tumor “compartment” where Nt is the amount of drug in the tumor. Exchange with the tumor is described by the rate constants kepr and kb, respectively. The rate constant kel describes elimination pathways including clearance by the kidneys and uptake by the MPS, but does not include tumor accumulation.[1] |
| Date | |
| Source | https://dx.doi.org/10.1371%2Fjournal.pone.0123461 |
| Author | Andrew D. Wong, Mao Ye, Martin B. Ulmschneider, Peter C. Searson |
Licensing
[edit]
This file is licensed under the Creative Commons Attribution 4.0 International license.
- You are free:
- to share – to copy, distribute and transmit the work
- to remix – to adapt the work
- Under the following conditions:
- attribution – You must give appropriate credit, provide a link to the license, and indicate if changes were made. You may do so in any reasonable manner, but not in any way that suggests the licensor endorses you or your use.
File history
Click on a date/time to view the file as it appeared at that time.
| Date/Time | Thumbnail | Dimensions | User | Comment | |
|---|---|---|---|---|---|
| current | 00:07, 9 April 2020 | | 512 × 341 (214 KB) | Rob Hurt (talk | contribs) | Uploaded a work by Andrew D. Wong, Mao Ye, Martin B. Ulmschneider, Peter C. Searson from https://dx.doi.org/10.1371%2Fjournal.pone.0123461 with UploadWizard |
You cannot overwrite this file.
File usage on Commons
The following page uses this file:
File usage on other wikis
The following other wikis use this file:
- Usage on en.wikipedia.org
- Usage on zh.wikipedia.org