File:Norrington Table.svg
Jump to navigation
Jump to search

Size of this PNG preview of this SVG file: 800 × 461 pixels. Other resolutions: 320 × 185 pixels | 640 × 369 pixels | 1,024 × 591 pixels | 1,280 × 738 pixels | 2,560 × 1,476 pixels | 1,219 × 703 pixels.
Original file (SVG file, nominally 1,219 × 703 pixels, file size: 877 KB)
Captions
Captions
Add a one-line explanation of what this file represents
Summary
[edit]
| Description |
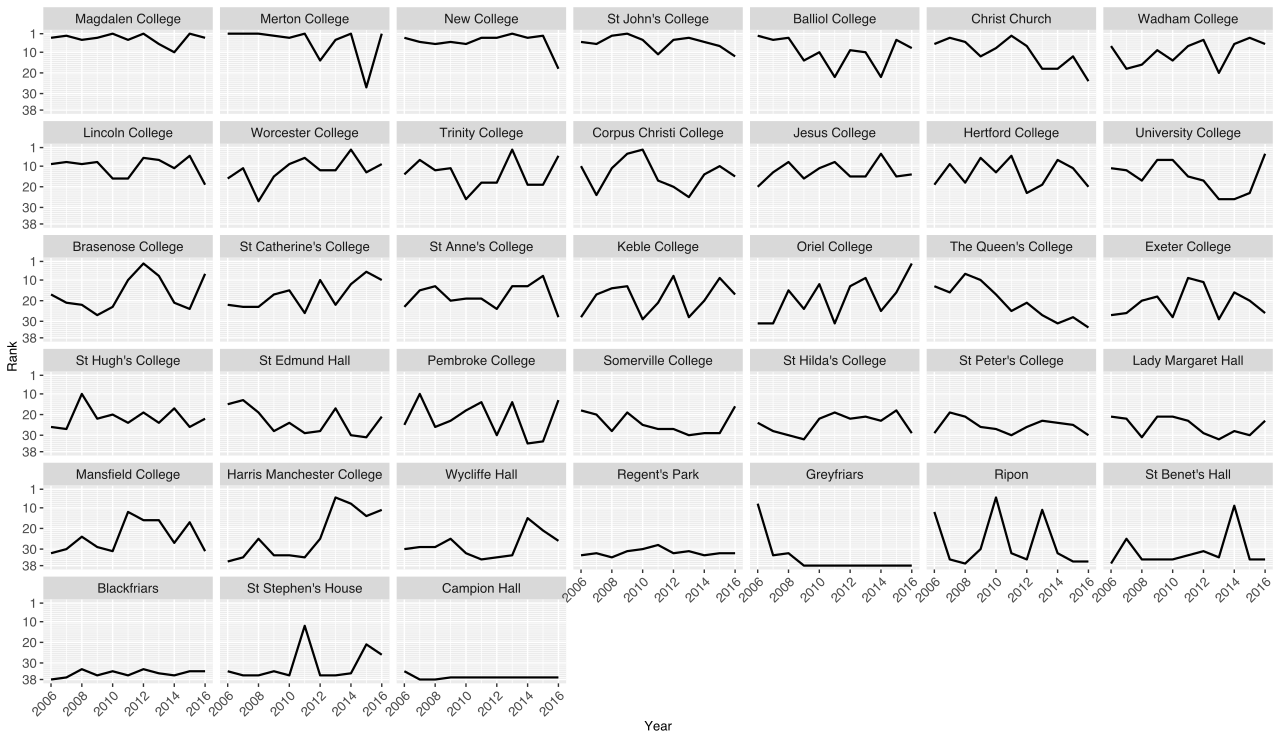
English: Norrington table rankings by year split by college. College ordered by mean score. |
| Date | |
| Source | Own work |
| Author | D Wells |
Licensing
[edit]
I, the copyright holder of this work, hereby publish it under the following license:
This file is licensed under the Creative Commons Attribution-Share Alike 4.0 International license.
- You are free:
- to share – to copy, distribute and transmit the work
- to remix – to adapt the work
- Under the following conditions:
- attribution – You must give appropriate credit, provide a link to the license, and indicate if changes were made. You may do so in any reasonable manner, but not in any way that suggests the licensor endorses you or your use.
- share alike – If you remix, transform, or build upon the material, you must distribute your contributions under the same or compatible license as the original.
Source code
[edit]
library(reshape2)
library(ggplot2)
library(ggrepel)
library(data.table)
# Data from https://www.ox.ac.uk/about/facts-and-figures/undergraduate-degree-classifications
# Load data
norrington <- fread("Norrington/Cleaned-Table 1.csv")

# make each row a score for each college in a given year
norrington <- melt(norrington, "V1")

# rename columns
names(norrington) <- c("College", "Year", "Score")

# calculate rankings
norrington[,Rank := as.integer(rank(-Score)), by = Year]

# order College by mean score
norrington$College <- factor(norrington$College, levels = norrington[, mean(Score, na.rm = TRUE), by = College][order(-V1)]$College)

# simplify years e.g. 2015/2016 -> 2016
norrington$Year <- as.integer(gsub("[0-9]+/", "", norrington$Year))

# create plot
ggplot(norrington, aes(Year, Rank)) +
  geom_line(size = 0.8) +
  scale_y_reverse(breaks = c(1, 10, 20, 30, 38), minor_breaks = 1:38) +
  theme(axis.text.x = element_text(angle = 45, hjust = 1))+
  facet_wrap(~College)

|
This media file is uncategorized.
Please help improve this media file by adding it to one or more categories, so it may be associated with related media files (how?), and so that it can be more easily found.
Please notify the uploader with {{subst:Please link images|File:Norrington Table.svg}} ~~~~ |
File history
Click on a date/time to view the file as it appeared at that time.
| Date/Time | Thumbnail | Dimensions | User | Comment | |
|---|---|---|---|---|---|
| current | 23:16, 18 December 2016 | | 1,219 × 703 (877 KB) | D Wells (talk | contribs) | User created page with UploadWizard |
You cannot overwrite this file.
File usage on Commons
There are no pages that use this file.