File:MDKQ anim ohne Ausreiser1.svg

Original file (SVG file, nominally 512 × 398 pixels, file size: 33 KB)
Captions
Captions
Contents
Summary
[edit]| DescriptionMDKQ anim ohne Ausreiser1.svg |
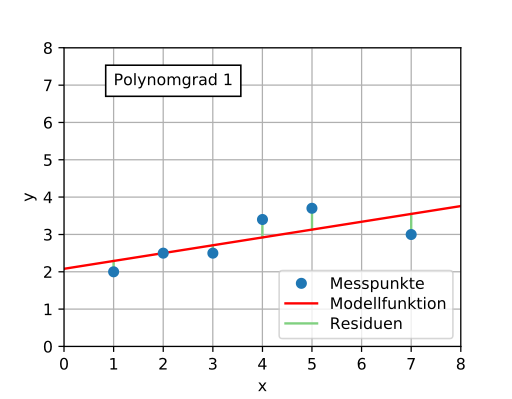
Deutsch: Teilbild einer Animation Polynomapproximation unterschiedlicher Polynomordnung |
| Date | |
| Source | MDKQ anim ohne Ausreiser.gif |
| Author | Johannes Kalliauer |
| Other versions | File:MDKQ anim ohne Ausreiser.gif |
This image was improved or created by the Wikigraphists of the Graphic Lab (de). You can propose images to clean up, improve, create or translate as well. |
Licensing
[edit]| This file is made available under the Creative Commons CC0 1.0 Universal Public Domain Dedication. | |
| The person who associated a work with this deed has dedicated the work to the public domain by waiving all of their rights to the work worldwide under copyright law, including all related and neighboring rights, to the extent allowed by law. You can copy, modify, distribute and perform the work, even for commercial purposes, all without asking permission.
http://creativecommons.org/publicdomain/zero/1.0/deed.enCC0Creative Commons Zero, Public Domain Dedicationfalsefalse |
Quellen: Skript zur Bildgenerierung
[edit]Erzeugungsskript, um die Grafik zu erstellen.
Anleitung
[edit]Benötigte Open-Source-Software:
- Python
- Python-Paket: numpy
- Python-Paket: matplotlib
Nach der Installation von Python den Quelltext in eine Datei mdkq.py kopieren und starten durch Doppelklicken oder in der Konsole durch Eingabe von
python mdkq.py
Python-Skript
[edit]#This source code is public domain
#Created by Christian Schirm
#Edited by Johannes Kalliauer
import numpy, pylab
from matplotlib.font_manager import FontProperties
import matplotlib.pyplot as plt
import matplotlib.patches as mpatches
from numpy.random import randn
x=[1,2,3,4,5,7]
y=[2.0,2.5,2.5,3.4,3.7,3]
for N in range(1,8):
A=numpy.zeros((N,N))
for i in range(N):
for j in range(N):
A[i,j]=sum(xi**(i+j) for xi in x)
b=numpy.zeros((N))
for i in range(N):
b[i]=sum(xi**(i)*yi for xi,yi in zip(x,y))
c=numpy.linalg.solve(A, b)
xr=numpy.asarray(x)
yr=numpy.sum([c[i]*xr**i for i in range(len(c))],axis=0)
residuen=[]
for i in range(len(x)): residuen+=[[xr[i],xr[i]],[y[i],yr[i]],'g-']
xneu=numpy.linspace(0, 8, num=100)
yneu=numpy.sum([c[i]*xneu**i for i in range(len(c))],axis=0)
plt.clf()
fig = plt.figure(figsize=(4.5, 3.5))
fig.subplotpars.bottom=0.13
y0=plt.plot(*residuen[:-3])
plt.setp(y0, color='#80d080', linewidth=1.5)
#y0=plt.plot(*residuen[-3:], label="Residuen")
y0,=plt.plot(*residuen[-3:])
plt.setp(y0, color='#80d080', linewidth=1.5)
#y2=plt.plot(xneu,yneu,'r-', label="Modellfunktion")
y2,=plt.plot(xneu,yneu,'r-')
#y1=plt.plot(x,y,'o', label="Messpunkte")
y1,=plt.plot(x,y,'o')
plt.xlabel('x')
plt.ylabel('y')
font = FontProperties()
font.set_size('medium')
leg = plt.legend([y1,y2,y0],['Messpunkte','Modellfunktion','Residuen'],frameon=True,loc='lower right',labelspacing=0.3,prop=font)
#leg = plt.legend(frameon=True,loc='lower right',labelspacing=0.3,prop=font)
plt.grid(True)
plt.axis([0, 8, 0, 8])
plt.text(1,7, "Polynomgrad "+str(N-1),bbox=dict(boxstyle="square,pad=0.5",color='white',ec='black',fill=True))
#plt.show()
plt.savefig('MDKQ_anim%i.png'%N)
plt.savefig('test.eps', format='eps', dpi=900)
plt.savefig("MDKQ_anim%i.svg"%N)
File history
Click on a date/time to view the file as it appeared at that time.
| Date/Time | Thumbnail | Dimensions | User | Comment | |
|---|---|---|---|---|---|
| current | 12:03, 18 July 2017 |  | 512 × 398 (33 KB) | JoKalliauer (talk | contribs) | |
| 12:02, 18 July 2017 |  | 512 × 398 (33 KB) | JoKalliauer (talk | contribs) |
You cannot overwrite this file.
File usage on Commons
The following 2 pages use this file:
File usage on other wikis
The following other wikis use this file:
- Usage on de.wikipedia.org
- Usage on de.wikiversity.org
- Hilbertraum/Orthonormalsystem/Einführung/Textabschnitt
- Endliche Menge/Funktion/Fehlerquadratsumme/Beispiel
- Kurs:Maß- und Integrationstheorie (Osnabrück 2022-2023)/Vorlesung 22
- Kurs:Maß- und Integrationstheorie (Osnabrück 2022-2023)/Vorlesung 22/kontrolle
- Hilbertraum/Orthonormalsystem/Ausgleichsgerade/Einführung/Textabschnitt
Metadata
This file contains additional information such as Exif metadata which may have been added by the digital camera, scanner, or software program used to create or digitize it. If the file has been modified from its original state, some details such as the timestamp may not fully reflect those of the original file. The timestamp is only as accurate as the clock in the camera, and it may be completely wrong.
| Width | 100% |
|---|---|
| Height | 100% |