File:Haplogroup frequencies of Kyrgyz.png
Jump to navigation
Jump to search
Size of this preview: 800 × 452 pixels. Other resolutions: 320 × 181 pixels | 640 × 362 pixels | 1,186 × 670 pixels.
Original file (1,186 × 670 pixels, file size: 166 KB, MIME type: image/png)
Captions
Captions
Add a one-line explanation of what this file represents
Summary
[edit]| Description |
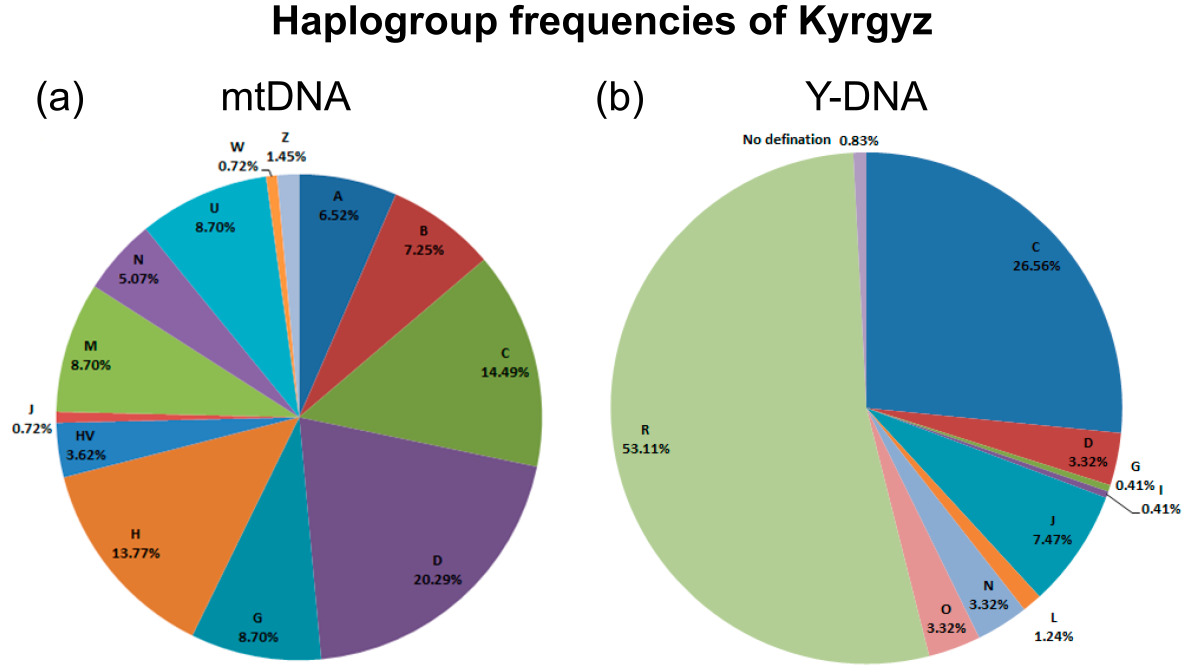
English: Study on Kyrgyz people living in northwest China. The pie charts for the haplogroup frequencies of the Kyrgyz group, (a) based on 59 mtDNA loci in 138 individuals, haplogroup M in this plot excluded haplogroups C, D, G and Z; haplogroup N in this plot excluded haplogroups A, B, J, H, HV, U and W; (b) based on 23 Y-STRs in 241 male individuals. |
| Date | Published: 18 May 2020 |
| Source | Guo, Y., Xia, Z., Cui, W., Chen, C., Jin, X., & Zhu, B. (2020). Joint Genetic Analyses of Mitochondrial and Y-Chromosome Molecular Markers for a Population from Northwest China. Genes, 11(5), 564. https://doi.org/10.3390/genes11050564 |
| Author | Yuxin Guo, Zhiyu Xia, Wei Cu, Chong Chen, Xiaoye Jin and Bofeng Zhu |
| Other versions |
|


Licensing
[edit]
This file is licensed under the Creative Commons Attribution 4.0 International license.
- You are free:
- to share – to copy, distribute and transmit the work
- to remix – to adapt the work
- Under the following conditions:
- attribution – You must give appropriate credit, provide a link to the license, and indicate if changes were made. You may do so in any reasonable manner, but not in any way that suggests the licensor endorses you or your use.
File history
Click on a date/time to view the file as it appeared at that time.
| Date/Time | Thumbnail | Dimensions | User | Comment | |
|---|---|---|---|---|---|
| current | 02:53, 16 January 2021 | | 1,186 × 670 (166 KB) | Was a bee (talk | contribs) | {{Information |Description={{en|1=The pie charts for the haplogroup frequencies of the Kyrgyz group, (a) based on 59 mtDNA loci in 138 individuals, haplogroup M in this plot excluded haplogroups C, D, G and Z; haplogroup N in this plot excluded haplogroups A, B, J, H, HV, U and W; (b) based on 23 Y-STRs in 241 male individuals.}} |Source=Guo, Y., Xia, Z., Cui, W., Chen, C., Jin, X., & Zhu, B. (2020). Joint Genetic Analyses of Mitochondrial and Y-Chromosome Molecular Markers for a Population f... |
You cannot overwrite this file.
File usage on Commons
The following 3 pages use this file: