File:Euclidean algorithm running time X Y.png
From Wikimedia Commons, the free media repository
Jump to navigation
Jump to search
Euclidean_algorithm_running_time_X_Y.png (361 × 361 pixels, file size: 22 KB, MIME type: image/png)
File information
Structured data
Captions
Captions
Add a one-line explanation of what this file represents
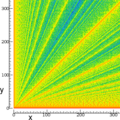
| DescriptionEuclidean algorithm running time X Y.png | Plot of the number of iterations used by the Euclidean algorithm to compute gcd(x, y) for x and y from 0 to 300. (Red is 0, the following colors in the spectrum correspond to higher values). |
| Date | |
| Source | en:File:Euclidean algorithm running time X Y.png |
| Author | en:User:Fredrik |
| Public domainPublic domainfalsefalse |
| I, the copyright holder of this work, release this work into the public domain. This applies worldwide. In some countries this may not be legally possible; if so: I grant anyone the right to use this work for any purpose, without any conditions, unless such conditions are required by law. |
| date/time | username | edit summary |
|---|---|---|
| 11:50, 13 November 2005 | en:User:Fredrik | ({{PD-self}}) |
| 12:37, 23 November 2004 | en:User:Fredrik | (description) |
| 12:34, 23 November 2004 | en:User:Fredrik | (Euclidean algorithm running time) |
File history
Click on a date/time to view the file as it appeared at that time.
| Date/Time | Thumbnail | Dimensions | User | Comment | |
|---|---|---|---|---|---|
| current | 15:13, 15 November 2012 |  | 361 × 361 (22 KB) | Hawky.diddiz (talk | contribs) | Optimized |
| 11:43, 24 February 2008 |  | 361 × 361 (50 KB) | Rebroad (talk | contribs) | cropped image (as numbers were not visible in thumbnail images used in articles), | |
| 19:39, 18 March 2006 |  | 880 × 880 (140 KB) | Maksim (talk | contribs) | La bildo estas kopiita de wikipedia:en. La originala priskribo estas: Plot of the number of iterations used by the Euclidean algorithm to compute gcd(x, y) for x and y from 0 to 800. (Red is 0, the following colors in the |
You cannot overwrite this file.
File usage on Commons
There are no pages that use this file.
File usage on other wikis
The following other wikis use this file:
- Usage on ar.wikipedia.org
- Usage on ast.wikipedia.org
- Usage on ca.wikipedia.org
- Usage on de.wikipedia.org
- Usage on de.wikiversity.org
- Kurs:Zahlentheorie (Osnabrück 2008)/Arbeitsblatt 3
- Euklidischer Algorithmus/Arbeitsblatt 1
- Euklidischer Algorithmus (Z)/Eigenschaften/Laufzeitbild/Aufgabe
- Kurs:Zahlentheorie (Osnabrück 2008)/Liegengelassene Aufgaben
- Kurs:Zahlentheorie (Osnabrück 2016-2017)/Arbeitsblatt 3
- Kurs:Zahlentheorie (Osnabrück 2016-2017)/Arbeitsblatt 3/kontrolle
- Kurs:Zahlentheorie (Osnabrück 2008)/Arbeitsblatt 3/kontrolle
- Usage on el.wikipedia.org
- Usage on eo.wikipedia.org
- Usage on es.wikipedia.org
- Usage on eu.wikipedia.org
- Usage on gl.wikipedia.org
- Usage on pt.wikipedia.org
- Usage on ro.wikipedia.org
- Usage on sl.wikipedia.org
- Usage on uk.wikipedia.org
- Usage on zh.wikipedia.org
Hidden categories:
