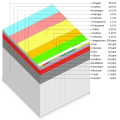
File:Element abundance human body ppm chart.svg
From Wikimedia Commons, the free media repository
Jump to navigation
Jump to search

Size of this PNG preview of this SVG file: 512 × 512 pixels. Other resolutions: 240 × 240 pixels | 480 × 480 pixels | 768 × 768 pixels | 1,024 × 1,024 pixels | 2,048 × 2,048 pixels.
Original file (SVG file, nominally 512 × 512 pixels, file size: 33 KB)
File information
Structured data
Captions
Captions
Add a one-line explanation of what this file represents
Summary
[edit]| DescriptionElement abundance human body ppm chart.svg | Parts-per-million cube showing relative abundance of elements by mass in an average adult human body by CMG Lee based on data at http://en.wikipedia.org/wiki/Composition_of_the_human_body . |
| Source | Own work |
| Author | Cmglee |
Licensing
[edit]I, the copyright holder of this work, hereby publish it under the following licenses:
This file is licensed under the Creative Commons Attribution-Share Alike 4.0 International license.
- You are free:
- to share – to copy, distribute and transmit the work
- to remix – to adapt the work
- Under the following conditions:
- attribution – You must give appropriate credit, provide a link to the license, and indicate if changes were made. You may do so in any reasonable manner, but not in any way that suggests the licensor endorses you or your use.
- share alike – If you remix, transform, or build upon the material, you must distribute your contributions under the same or compatible license as the original.

|
Permission is granted to copy, distribute and/or modify this document under the terms of the GNU Free Documentation License, Version 1.2 or any later version published by the Free Software Foundation; with no Invariant Sections, no Front-Cover Texts, and no Back-Cover Texts. A copy of the license is included in the section entitled GNU Free Documentation License.http://www.gnu.org/copyleft/fdl.htmlGFDLGNU Free Documentation Licensetruetrue |
You may select the license of your choice.
File history
Click on a date/time to view the file as it appeared at that time.
| Date/Time | Thumbnail | Dimensions | User | Comment | |
|---|---|---|---|---|---|
| current | 06:41, 10 December 2023 |  | 512 × 512 (33 KB) | Cmglee (talk | contribs) | Add figure, chemical symbols and 2 significant figures |
| 17:57, 9 December 2023 |  | 512 × 512 (31 KB) | Cmglee (talk | contribs) | Swap sulfur and potassium | |
| 17:47, 9 December 2023 |  | 512 × 512 (31 KB) | Cmglee (talk | contribs) | Align bends and add whitespace | |
| 17:40, 9 December 2023 |  | 512 × 512 (31 KB) | Cmglee (talk | contribs) | {{Information |Description=Parts-per-million cube showing relative abundance of elements by mass in an average human body by CMG Lee. |Source={{own}} |Date= |Author= Cmglee |Permission= |other_versions= }} Category:4-3-2 trimetric projection Category:Parts-per-million chart Category:Relative abundance distribution Category:Chemical elements Category:Human body composition |
You cannot overwrite this file.
File usage on Commons
There are no pages that use this file.
File usage on other wikis
The following other wikis use this file:
- Usage on en.wikipedia.org
Metadata
This file contains additional information such as Exif metadata which may have been added by the digital camera, scanner, or software program used to create or digitize it. If the file has been modified from its original state, some details such as the timestamp may not fully reflect those of the original file. The timestamp is only as accurate as the clock in the camera, and it may be completely wrong.
| Short title | element abundance human body ppm chart |
|---|---|
| Image title | Parts-per-million cube showing relative abundance of elements by mass in an average adult human body by CMG Lee. |
| Width | 100% |
| Height | 100% |