Uploads by Itangalo
Jump to navigation
Jump to search
For Itangalo (talk · contributions · Move log · block log · uploads · Abuse filter log)
This special page shows all uploaded files that have not been deleted; for those see the upload log.
| Date | Name | Thumbnail | Size | Description |
|---|---|---|---|---|
| 11:03, 21 April 2021 | Prioriteringsdjävulen.svg (file) |  |
4 KB | Cross-wiki upload from sv.wikipedia.org |
| 10:36, 21 April 2021 | Prioriteringsdjävulen (cdot).png (file) |  |
6 KB | Cross-wiki upload from sv.wikipedia.org |
| 09:20, 19 January 2014 | Sammansatta funktioner och derivata.webm (file) | 10.9 MB | Imported from http://www.youtube.com/watch?v=23DB08w16oQ | |
| 17:55, 17 January 2014 | GeoGebra för att rita grafer.webm (file) | 9.42 MB | Imported from http://www.youtube.com/watch?v=uA9sdsxc4vc | |
| 14:31, 27 September 2013 | Andragradsfunktion med brus 2.png (file) |  |
16 KB | User created page with UploadWizard |
| 14:31, 27 September 2013 | Andragradsfunktion med brus 3.png (file) |  |
15 KB | User created page with UploadWizard |
| 14:30, 27 September 2013 | Andragradsfunktion med brus 1.png (file) |  |
15 KB | {{Information |Description ={{en|1=A scatter plot that fits well to a quadratic function.}} {{sv|1=Ett punktdiagram med data som passar väl till en andragradsfunktion.}} |Source ={{own}} |Author =Itangalo |Date ... |
| 10:26, 31 August 2013 | Floor(x).png (file) |  |
64 KB | User created page with UploadWizard |
| 21:34, 14 August 2013 | Livslängd och fattigdom (datorskapad trendlinje).png (file) |  |
62 KB | {{Information |Description ={{sv|1=Förväntad livslängd plottat mot andel av befolkning som lever under fattigdomsgränsen, för ett 50-tal länder, inklusive en linjär funktionsanpassning. Data kommer från Världsbanken, via Gapminder.}} |Sourc... |
| 19:43, 14 August 2013 | Livslängd och fattigdom (manuell trendlinje).png (file) |  |
54 KB | {{Information |Description ={{sv|1=Data över förväntad livslängd plottat mot andel fattigdom i ett 50-tal länder, samt en manuellt skissad trendlinje infogad.}} |Source ={{own}} |Author =Itangalo |Date ... |
| 15:36, 12 August 2013 | Livslängd och fattigdom.png (file) |  |
56 KB | {{Information |Description ={{sv|1=Förväntad livslängd (y) plottat mot andel av befolkningen som lever på mindre än motsvarande 2 USD per dag (x). Data kommer från Världsdatabanken och gäller för 2004. Tack till GapMinder som gjort datan me... |
| 10:31, 9 August 2013 | Exponential functions.png (file) |  |
73 KB | {{Information |Description ={{en|1=Graphs of three exponential functions. Created using GeoGebra.}} |Source ={{own}} |Author =Itangalo |Date = |Permission = |other_versions = }} |
| 14:14, 4 August 2013 | Vertical line.png (file) |  |
43 KB | {{Information |Description ={{en|1=Created using GeoGebra.}} |Source ={{own}} |Author =Itangalo |Date =2013-08-02 |Permission = |other_versions = }} |
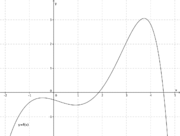
| 11:49, 3 August 2013 | Arbitrary function graph.png (file) |  |
72 KB | {{Information |Description ={{en|1={{Information |Description=Graph intended to show an arbitrary function |Source=Self-made |Date=2013-08-02 |Author=(Johan Falk) (~~~) }} Image generated with GeoGebra.}} |Source ={{own}} |Author =... |
| 09:48, 12 December 2008 | Radionella tal.png (file) |  |
79 KB | {{Information |Description={{en|1=Illustration of how the rational numbers may be ordered and counted. Illustration contains a grid and an arrow, and two Swedish words (the words for "nominator" and "denominator").}} {{sv|1=Illustration över hur de ratio |