Category:Enzyme kinetics
Jump to navigation
Jump to search
study of biochemical reaction rates catalysed by an enzyme | |||||
| Upload media | |||||
| Spoken text audio | |||||
|---|---|---|---|---|---|
| Subclass of | |||||
| |||||
Subcategories
This category has the following 6 subcategories, out of 6 total.
Media in category "Enzyme kinetics"
The following 167 files are in this category, out of 167 total.
-
-
Activation2 rus.jpg 349 × 243; 59 KB
-
Activation2 rus.svg 978 × 599; 1 KB
-
Active Site with good residue view.png 411 × 575; 103 KB
-
Activity distribution graph.png 586 × 450; 11 KB
-
Activity plot different irreversible enzyme inhibitions.svg 514 × 283; 19 KB
-
Aktywność enzymu.svg 846 × 646; 34 KB
-
Alan Fersht in his rooms at Gonville and Caius.jpg 357 × 470; 168 KB
-
Allosteric competitive inhibition 3 ku.svg 840 × 580; 31 KB
-
Allosteric competitive inhibition 3.svg 840 × 580; 26 KB
-
Allosteric v by S curve sr.svg 565 × 435; 14 KB
-
Allosteric v by S curve.svg 565 × 435; 13 KB
-
Antibiotic formation pathway.svg 534 × 798; 171 KB
-
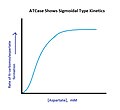
ATCase Sigmoidal Kinetics.jpg 607 × 557; 34 KB
-
Bir substrat.svg 686 × 256; 23 KB
-
Burst phase-pt.svg 704 × 490; 3 KB
-
Burst phase-sr.svg 704 × 487; 5 KB
-
Burst phase.svg 704 × 487; 5 KB
-
Carbonic anhydrase reaction in tissue (hu).svg 504 × 395; 20 KB
-
Carbonic anhydrase reaction in tissue da.svg 458 × 340; 18 KB
-
Carbonic anhydrase reaction in tissue sv.svg 504 × 395; 10 KB
-
Carbonic anhydrase reaction in tissue-tr.svg 504 × 395; 20 KB
-
Carbonic anhydrase reaction in tissue.svg 504 × 395; 31 KB
-
Catalisi enzimatica.svg 483 × 188; 10 KB
-
Catalisis enzimatica.jpg 1,021 × 772; 207 KB
-
Catalisis enzimatica1.jpg 546 × 428; 25 KB
-
Catalisis enzimatica1.svg 493 × 373; 184 KB
-
CatalysisScheme-en.svg 801 × 418; 1 KB
-
CatalysisScheme-ru.svg 801 × 418; 1 KB
-
CatalysisScheme.png 1,159 × 681; 35 KB
-
Comp inhib.svg 840 × 580; 25 KB
-
Comparison of stopped flow with quenched flow.png 294 × 230; 14 KB
-
Competitive inhibition (Danish).svg 820 × 575; 15 KB
-
Competitive inhibitor he.svg 134 × 284; 10 KB
-
Competitive inhibitor hi.svg 134 × 284; 16 KB
-
Competitive kinetics.PNG 590 × 449; 15 KB
-
-
Dependence of velocity on substrate concentration.svg 541 × 418; 3 KB
-
Dependency Ks of inhibitor concentration.svg 514 × 283; 7 KB
-
Diagram of continuous flow.png 2,410 × 909; 155 KB
-
Diagram of stopped flow equipment.png 2,412 × 943; 125 KB
-
Diagramma attivazione.svg 504 × 395; 12 KB
-
Direct-linear-plot.jpg 2,187 × 1,099; 289 KB
-
Direct-Observation-of-Strand-Passage-by-DNA-Topoisomerase-and-Its-Limited-Processivity-pone.0034920.s005.ogv 1 min 1 s, 220 × 156; 691 KB
-
Direct-Observation-of-the-Myosin-Va-Recovery-Stroke-That-Contributes-to-Unidirectional-Stepping-pbio.1001031.s010.ogv 1 min 48 s, 176 × 144; 2.35 MB
-
Effect of ATCase Kinetics.jpg 592 × 554; 20 KB
-
Effect of CTP on ATCase kinetics.JPG 320 × 260; 9 KB
-
Effect of enzyme on activation energy.svg 489 × 380; 6 KB
-
ElasticityCurveEnzyme.png 1,317 × 624; 76 KB
-
Energia aktywacji.svg 505 × 360; 181 KB
-
Energiediagramm-Enzymreaktion.svg 504 × 395; 18 KB
-
Entzyme kinetics.JPG 327 × 46; 3 KB
-
Enzima alostérica.svg 363 × 356; 5 KB
-
Enzima-sustrato.pdf 491 × 925; 402 KB
-
Enzimkin1.jpg 582 × 425; 50 KB
-
Enzimkin2.jpg 625 × 626; 72 KB
-
Enzimkin3.jpg 436 × 318; 42 KB
-
Enzymatic mechanism model (zh-tw).png 983 × 718; 29 KB
-
Enzymatic mechanism model zh.png 983 × 718; 25 KB
-
Enzyme accelerating reaction.jpg 535 × 516; 28 KB
-
Enzyme allostery en.svg 606 × 332; 146 KB
-
Enzyme allostery es.png 574 × 301; 35 KB
-
Enzyme allostery es.svg 606 × 332; 148 KB
-
Enzyme allostery.png 577 × 285; 18 KB
-
Enzyme catalysis delta delta G es.png 610 × 400; 8 KB
-
Enzyme catalysis energy levels 2-ru.svg 733 × 301; 2 KB
-
Enzyme catalysis energy levels 2.svg 1,200 × 489; 214 KB
-
Enzyme catalysis energy levels.png 1,954 × 788; 87 KB
-
Enzyme decreases the activation energy.png 968 × 493; 19 KB
-
Enzyme Kinetics.pdf 1,239 × 1,752, 4 pages; 90 KB
-
Enzyme mechanism 2.svg 400 × 125; 126 KB
-
Enzyme mechanism.png 1,582 × 510; 38 KB
-
Enzyme Model.sr.jpg 640 × 606; 136 KB
-
Enzyme saturation.png 913 × 255; 7 KB
-
Enzyme-substrate difusion-controlled reaction.jpg 2,713 × 1,480; 279 KB
-
Enzymes free energy change en.svg 405 × 333; 58 KB
-
Enzymkatalyse.png 2,089 × 664; 68 KB
-
Enzymkinetiekactivatiecurve.svg 504 × 395; 16 KB
-
Enzymkinetik.jpg 615 × 459; 15 KB
-
Enzymkinetik2.jpg 618 × 463; 8 KB
-
Enzymproductconcentratiecurve.svg 467 × 364; 5 KB
-
Equilibrio enzima-sustrato.png 714 × 312; 8 KB
-
Equilibrio enzima-sustrato.svg 714 × 312; 233 KB
-
Estado pre-estacionario pt.png 658 × 495; 19 KB
-
Estado pre-estacionario.png 720 × 540; 8 KB
-
Feedback inhibition.svg 744 × 1,052; 96 KB
-
Gráfica de la saturación de una enzima.jpg 720 × 540; 16 KB
-
Hanes-plot.jpg 1,566 × 1,133; 153 KB
-
Identification-of-the-Allosteric-Regulatory-Site-of-Insulysin-pone.0020864.s012.ogv 4.0 s, 1,280 × 720; 669 KB
-
Identification-of-the-Allosteric-Regulatory-Site-of-Insulysin-pone.0020864.s013.ogv 4.0 s, 1,280 × 720; 405 KB
-
Induced fit diagram da.svg 648 × 253; 21 KB
-
Induced fit diagram zh.png 648 × 253; 24 KB
-
Inhibición enzimática.png 720 × 399; 8 KB
-
Inhibicja kompetycyjna.svg 800 × 1,286; 502 KB
-
Inhibiteur incompetitif.png 133 × 345; 17 KB
-
Inibizione competitiva.svg 820 × 575; 26 KB
-
Inibizione non competitiva.svg 776 × 701; 35 KB
-
-
Katalizowanie reakcji przez enzymy.svg 630 × 245; 224 KB
-
KinasePhosphatase.svg 214 × 206; 24 KB
-
KinEnzymo(en).svg 990 × 550; 138 KB
-
KinEnzymo(pl).svg 955 × 493; 148 KB
-
KinEnzymo(sr).svg 990 × 550; 193 KB
-
Kinteticsuncompetitiveinhibitor.jpg 553 × 458; 23 KB
-
Kompetitiver und nichtkompetitiver Antagonist.png 362 × 296; 10 KB
-
Linear4Step.png 812 × 194; 28 KB
-
Lineweaver-Burk plot.svg 530 × 440; 4 KB
-
Mapping-of-Enzyme-Kinetics-on-a-Microfluidic-Device-pone.0153437.s006.ogv 31 s, 1,440 × 1,080; 3.82 MB
-
Mecanisme catalític d'una proteasa.jpg 1,280 × 720; 44 KB
-
Mecanismo mas tasas.svg 467 × 167; 10 KB
-
Mech1.jpg 1,780 × 780; 62 KB
-
Mechanism plus rates.PNG 487 × 149; 21 KB
-
-
MM-order.jpg 2,191 × 1,066; 319 KB
-
MMLogPlot.jpg 1,408 × 1,054; 243 KB
-
Mnemonical model.png 235 × 185; 13 KB
-
Modification of lysine by cluster.png 1,264 × 1,024; 948 KB
-
Monosupstratni mehanizam.PNG 372 × 105; 7 KB
-
Noncompetitive.jpg 837 × 489; 29 KB
-
Ping pong.png 445 × 66; 7 KB
-
Ping pong.svg 445 × 66; 13 KB
-
PlotAandAPVersusk1.svg 576 × 432; 31 KB
-
Q10 graph a.svg 1,800 × 668; 109 KB
-
Q10 graph c.svg 1,800 × 668; 166 KB
-
Quenched Flow method for fast reactions.png 2,187 × 825; 85 KB
-
Quenched-flow method for fast reactions.png 2,480 × 3,508; 29 KB
-
Random order ternary mechanism.png 450 × 218; 29 KB
-
Random order ternary mechanism.svg 450 × 217; 15 KB
-
Reaction scheme competitive enzyme inhibition.svg 514 × 283; 25 KB
-
Reaction scheme enzyme inhibition 1.svg 514 × 283; 49 KB
-
Reaction scheme enzyme inhibition 2.svg 514 × 283; 40 KB
-
Reaction scheme non-competitive enzyme inhibition.svg 514 × 283; 43 KB
-
Reaction scheme uncompetitive enzyme inhibition.svg 514 × 283; 26 KB
-
Realistic direct linear plot with errors.jpg 2,187 × 1,149; 340 KB
-
RevHillScheme.png 600 × 469; 41 KB
-
Saturacao de uma enzima.jpg 689 × 270; 22 KB
-
Saturación de una enzima.jpg 720 × 312; 22 KB
-
Scatchard Plot.gif 741 × 504; 6 KB
-
Scatchard plot.svg 531 × 531; 29 KB
-
Scatchardthree.gif 204 × 145; 2 KB
-
Schemat katalizowanej reakcji.svg 545 × 180; 54 KB
-
Simple mechanism - PT.svg 387 × 150; 26 KB
-
Simple mechanism of enzyme reaction (zh-tw).png 567 × 184; 15 KB
-
Simple mechanism of enzyme reaction zh.png 567 × 184; 12 KB
-
Simple mechanism pt.svg 483 × 188; 4 KB
-
Simple mechanism.svg 483 × 188; 7 KB
-
Spastins-Microtubule-Binding-Properties-and-Comparison-to-Katanin-pone.0050161.s006.ogv 10 min 49 s, 594 × 232; 48.12 MB
-
Spastins-Microtubule-Binding-Properties-and-Comparison-to-Katanin-pone.0050161.s007.ogv 2 min 3 s, 232 × 310; 6.92 MB
-
Spastins-Microtubule-Binding-Properties-and-Comparison-to-Katanin-pone.0050161.s008.ogv 44 s, 500 × 500; 12.4 MB
-
Spastins-Microtubule-Binding-Properties-and-Comparison-to-Katanin-pone.0050161.s009.ogv 1.0 s, 500 × 500; 1.88 MB
-
Stopped flow apparatus.png 2,480 × 3,508; 109 KB
-
TS3.png 2,620 × 743; 106 KB
-
TSA 1.png 1,216 × 353; 45 KB
-
TSA3.png 2,036 × 743; 88 KB
-
Two substrates.png 648 × 253; 16 KB
-
Two substrates.svg 685 × 256; 22 KB
-
UNCOMPETITIVE.jpg 837 × 489; 29 KB
-
Wallace3.png 627 × 762; 23 KB
-
Yarışmalı engelleme 2.svg 830 × 315; 15 KB
-
Yarışmalı engelleme.svg 840 × 580; 24 KB
-
Yarışmasız engelleme 2.svg 830 × 315; 15 KB
-
Yarışmasız engelleme.svg 840 × 580; 26 KB
-
アロステリック効果 アスパラギン酸キナーゼとリシン.png 2,054 × 401; 27 KB
-
説明図 酵素 酸塩基触媒部位.png 445 × 312; 48 KB
-
説明図 酵素 阻害様式と反応速度.png 520 × 224; 11 KB
-
説明図 酵素反応速度曲線.PNG 831 × 238; 16 KB
-
酵素反応機構.gif 341 × 52; 612 bytes


