Category:Electricity graphs
Jump to navigation
Jump to search
Subcategories
This category has the following 2 subcategories, out of 2 total.
E
L
- Load profiles (14 F)
Media in category "Electricity graphs"
The following 48 files are in this category, out of 48 total.
-
2014 Hydro Electric Energy Generation Profile.png 504 × 342; 11 KB
-
2014 Other Bio Electric Energy Generation Profile.png 504 × 342; 10 KB
-
2014 Renewable Electric Energy Generation.png 504 × 342; 16 KB
-
2014 Renewables Electric Energy Generation Profile.png 504 × 342; 12 KB
-
230volt-50Hz-voltage.png 2,053 × 1,104; 83 KB
-
ATTParkannualoutput.png 590 × 320; 10 KB
-
ATTParksolarpaneloutput.png 955 × 375; 16 KB
-
Average Retail Prices for Electricity in the US.png 1,000 × 500; 55 KB
-
Coef-prod-electronucleaire-fr.svg 757 × 386; 151 KB
-
DECC electricity data.pdf 1,752 × 1,239; 194 KB
-
Dunkelflaute-Germany-2023.svg 800 × 540; 226 KB
-
Dunkelflaute-Germany-2024-11.svg 853 × 576; 138 KB
-
Elec-fossil-nuclear-renewables-cs.svg 850 × 600; 37 KB
-
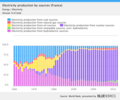
Electricity production by sources in France.png 1,200 × 1,000; 60 KB
-
Elektrizitate-ekoizpena munduan, 2017an (bertikalki).png 1,665 × 2,247; 111 KB
-
Elektrizitate-ekoizpena munduan, 2017an.png 2,592 × 1,722; 98 KB
-
Energy graph2.png 250 × 313; 14 KB
-
Energy tunisia.svg 298 × 254; 90 KB
-
EonWestfalenWeserArbeitspreise.jpg 659 × 533; 130 KB
-
Erie Shores Wind Farm output Aug-Jul 2008.gif 375 × 320; 7 KB
-
Evolution filiere nucl France OPECST.svg 1,265 × 300; 71 KB
-
Greenhouse emissions by electricity source.PNG 944 × 537; 26 KB
-
Grid service batteries (IEA 2024).png 922 × 643; 162 KB
-
Last Wind Solar Jan2024.png 1,875 × 750; 61 KB
-
Leistung EU.png 792 × 612; 14 KB
-
Leistung EU.svg 1,051 × 741; 16 KB
-
Linanillo.jpg 359 × 359; 8 KB
-
Magnetization2.jpg 600 × 600; 50 KB
-
Merit-Order-Effekt-2.png 1,107 × 899; 59 KB
-
Merit-Order-Effekt.svg 800 × 650; 12 KB
-
Nuclear capacity as a proportion of total capacity, 1955-2016.png 1,287 × 767; 71 KB
-
Obrázek19a.png 207 × 108; 7 KB
-
Ontario electricity supply 2005.png 717 × 519; 56 KB
-
Ontariowindfarmshourlyoutputover15days.gif 2,268 × 292; 51 KB
-
Pumpspeicherkraftwerk engl.png 754 × 538; 8 KB
-
Renewables need flexible backup not baseload.png 4,168 × 3,201; 511 KB
-
Strompreisentwicklung-BRD 2000-2010.png 934 × 698; 66 KB
-
Strompreisindex01.png 1,584 × 1,224; 32 KB
-
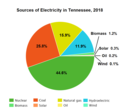
Tennessee electricity sources 2018.png 881 × 814; 54 KB
-
Texas Power Crisis.webp 10,673 × 1,738; 593 KB
-
Tokyo and Vancouver electricity and gas prices.png 375 × 574; 22 KB
-
US nuclear refueling outage duration.png 492 × 420; 12 KB
-
Windeinspeisung Deutschland-Luxemburg Januar 2020.png 800 × 500; 13 KB
-
Wisconsin electricity generation by type.webp 4,502 × 1,630; 273 KB
-
World electricity generation by source pie chart.svg 800 × 600; 11 KB
-
World Electricity Generation Pie Chart.png 800 × 600; 16 KB


