Category:CDC Vital Signs derivatives
Jump to navigation
Jump to search
Media in category "CDC Vital Signs derivatives"
The following 148 files are in this category, out of 148 total.
-
Adult Smoking Prevalence by State US 2010.png 4,521 × 1,979; 163 KB
-
Adults smoking rates in the US.png 4,341 × 2,744; 217 KB
-
Adults with asthma, US, 2009.png 3,538 × 2,145; 151 KB
-
Age adjusted colorectal cancer incidence and death rates by year, 1975-2007 US.png 4,532 × 1,749; 439 KB
-
Alcohol drinking icon.svg 103 × 153; 7 KB
-
Amount of prescription painkillers sold by state per 10,000 people (2010).png 3,655 × 2,070; 157 KB
-
An assortment of food.tiff 665 × 1,297; 2.71 MB
-
Asthma by age and sex US, 2001-2009.png 2,901 × 1,805; 77 KB
-
Asthma self-management education by age, US, 2008.png 2,809 × 1,765; 97 KB
-
Australia flag waving icon.svg 44 × 27; 50 KB
-
Barn clip art.svg 64 × 60; 8 KB
-
Barn with farm clip art.svg 152 × 101; 25 KB
-
Binge drinking can lead to....png 3,655 × 1,440; 90 KB
-
Blue ambulance icon.svg 51 × 34; 2 KB
-
Blue asthma inhaler graphic.svg 144 × 186; 4 KB
-
Blue building icon.svg 86 × 64; 4 KB
-
Blue calendar icon with dates crossed out.svg 89 × 96; 23 KB
-
Blue couple icon.svg 82 × 95; 3 KB
-
Blue doctor icon.svg 36 × 92; 5 KB
-
Blue flag icon.svg 1,025 × 614; 9 KB
-
Blue health shield icon.svg 69 × 75; 1 KB
-
Blue magnifying glass icon.svg 79 × 97; 301 bytes
-
Blue pill container spilled icon.svg 92 × 67; 4 KB
-
Blue priest icon.svg 36 × 102; 3 KB
-
Blue retail business icon.svg 61 × 45; 5 KB
-
Blue vial clip art.svg 58 × 102; 2 KB
-
Boy using inhaler.tiff 434 × 1,010; 1.09 MB
-
Breastfeeding chart.svg 1,167 × 698; 30 KB
-
Brown community icon.svg 149 × 69; 1 KB
-
Canada flag waving icon.svg 44 × 31; 45 KB
-
Cause of child injury and prevention tips in the US.png 2,550 × 3,300; 302 KB
-
Change in E. coli 0157 and Salmonella infection 1996-2010, US.png 2,243 × 1,680; 293 KB
-
Checking blood pressure.tiff 350 × 846; 478 KB
-
Chef cooking clip art.svg 55 × 101; 21 KB
-
Chicken clip art.svg 52 × 57; 14 KB
-
Child 0-19 injury death rate by state in the US 2009.png 3,528 × 1,561; 115 KB
-
Child being pushed on swing clip art.svg 132 × 132; 74 KB
-
Child in crib being supervised clip art.svg 139 × 132; 230 KB
-
Child in diaper icon.svg 64 × 91; 2 KB
-
Child in pool clip art.svg 138 × 132; 227 KB
-
Child injury death rate worldwide comparison 2009.png 4,824 × 1,282; 151 KB
-
Child placed in car seat clip art.svg 132 × 132; 138 KB
-
Children in a group.tiff 540 × 349; 475 KB
-
Colorectal Cancer Screening in the US 2008.png 4,478 × 2,403; 201 KB
-
Cooking while holding infant clip art.svg 132 × 132; 179 KB
-
Couple dining clip art.svg 165 × 205; 28 KB
-
Deaths caused by C. difficle infections 1999-2010 US.png 2,295 × 1,878; 178 KB
-
Doctor discussing diagnosis with patient.tiff 942 × 736; 3.12 MB
-
Doctor examining document.tiff 1,518 × 2,845; 14.61 MB
-
Drug overdose death rates by state per 100,000 people 2008 US.png 3,644 × 1,912; 144 KB
-
Elderly people along beach.tiff 920 × 747; 1.43 MB
-
Empty shopping cart clip art.svg 57 × 49; 13 KB
-
Exposure to secondhand smoke by age, race, and poverty level US.png 2,374 × 2,160; 85 KB
-
Factory clip art.svg 126 × 110; 4 KB
-
Family eating clip art.svg 172 × 173; 27 KB
-
Foods associated with Salmonella outbreaks in US.png 2,002 × 2,577; 99 KB
-
France flag waving icon.svg 45 × 28; 35 KB
-
Getting detergent clip art.svg 132 × 132; 112 KB
-
Green band-aid icon.svg 45 × 41; 3 KB
-
Green retail business icon.svg 61 × 45; 5 KB
-
Guy shopping for food.tiff 423 × 855; 977 KB
-
Healthcare form.tiff 423 × 840; 529 KB
-
Heart Disease Death Rates 2002-2007 Adults 35+ by county US.png 4,173 × 2,261; 1.23 MB
-
Hospital patient reading newspaper.tiff 1,691 × 3,603; 19.69 MB
-
Hospital room1.tiff 1,797 × 3,300; 16.66 MB
-
Hospital worker putting on sterile gloves.tiff 423 × 815; 823 KB
-
How C. difficile spreads.png 2,477 × 3,232; 887 KB
-
Italy flag waving icon.svg 38 × 29; 36 KB
-
Mammogram being conducted.tiff 1,245 × 2,662; 11.75 MB
-
Mammogram Cancer Screening in the US 2008.png 4,355 × 2,240; 181 KB
-
Martini glass icon.svg 58 × 84; 25 KB
-
Mexico flag waving icon.svg 38 × 29; 131 KB
-
Mother wtih infant icon.svg 83 × 110; 2 KB
-
Netherlands flag waving icon.svg 44 × 27; 53 KB
-
New Zealand flag waving icon.svg 42 × 26; 50 KB
-
No smoking sign on wall.tiff 1,161 × 1,032; 2.48 MB
-
No smoking sign.tiff 980 × 769; 2.56 MB
-
Orange beer icon.svg 24 × 52; 9 KB
-
Orange people icon.svg 98 × 109; 4 KB
-
Orange watch clip art.svg 61 × 80; 4 KB
-
Patient having blood pressure taken by nurse.tiff 1,296 × 2,702; 10.33 MB
-
Pedestrian traffic.tiff 423 × 834; 939 KB
-
People walk to get to places they want to go when places are nearby.png 3,315 × 2,644; 1.5 MB
-
Percent of adults who binge drink US 2010.png 2,880 × 1,575; 96 KB
-
Percent of adults who smoke by education level US 2010.png 1,890 × 1,620; 64 KB
-
Percent of adults who smoke by poverty level US 2010.png 2,048 × 1,609; 47 KB
-
Percent of adults who smoke by race-ethnic group US 2010.png 2,587 × 1,474; 78 KB
-
Percent of adults who smoke by sex US 2010.png 1,699 × 1,181; 30 KB
-
Percentage of adults who walk for physical activity in the US.png 4,590 × 2,265; 1.55 MB
-
Percentage of births at baby-friendly facilities in 2011 by state, US.png 4,613 × 1,920; 161 KB
-
Percentage of US adults 18-64 years old without health insurance in 2009.png 3,133 × 2,082; 94 KB
-
Percentage of US hospitals with policies supporting breastfeedin 2007 and 2009.png 4,332 × 1,632; 112 KB
-
Percentage tested for HIV by gender.png 2,464 × 1,125; 42 KB
-
Percentage tested for HIV by race-ethnicity.png 1,991 × 1,935; 73 KB
-
Person buckling seatbelt in car.tiff 1,817 × 3,673; 22.14 MB
-
Person watching television on couch.tiff 1,268 × 2,474; 7.36 MB
-
Person weighing on a sclae.tiff 1,269 × 2,563; 8.56 MB
-
Pink businessman icon.svg 37 × 95; 3 KB
-
Pink businesswoman icon.svg 44 × 95; 8 KB
-
Pink government building icon.svg 86 × 76; 2 KB
-
Pink January 2011 calendar icon.svg 88 × 113; 23 KB
-
Pink kids icon.svg 62 × 53; 3 KB
-
Pink seatbelt icon.svg 86 × 114; 2 KB
-
Poland flag waving icon.svg 43 × 27; 40 KB
-
Pouring a glass of red wine.tiff 423 × 817; 718 KB
-
Pouring a glass of white wine.tiff 423 × 854; 262 KB
-
Prescription medication being dispensed.tiff 1,258 × 2,485; 5.55 MB
-
Prevalence of Binge Drinking Among Adults, 2009 US.png 3,352 × 2,070; 142 KB
-
Prevention of Salmonella from the farm to table infographic.png 2,625 × 3,375; 537 KB
-
Purple tombstone icon.svg 39 × 52; 2 KB
-
Purple watch icon.svg 70 × 85; 3 KB
-
Rate of AIDS diagnosis amongst persons 18-64 by state 2008 US.png 3,346 × 2,384; 152 KB
-
Red beer mug icon.svg 67 × 89; 6 KB
-
Restaurant building clip art.svg 172 × 126; 21 KB
-
Risks form smoking-smoking can damage every part of the body.png 3,858 × 3,104; 494 KB
-
Salt levels can vary in food items.png 1,957 × 1,474; 68 KB
-
Seat belt use by sex, age, and type of law, US, 2008.png 4,655 × 2,138; 141 KB
-
Seat belt use by type of law, US, 2002.png 3,891 × 1,867; 197 KB
-
Seat belt use by type of law, US, 2008.png 4,094 × 1,778; 209 KB
-
Shopping cart with food clip art 2.svg 307 × 314; 39 KB
-
Shopping cart with food clip art.svg 121 × 99; 33 KB
-
Some toxic components in smoke.png 2,022 × 3,107; 103 KB
-
States required to public report some healthcare-associated infections, 2011.png 3,509 × 1,892; 706 KB
-
Store clip art.svg 169 × 124; 109 KB
-
Stroke Death Rates 2002-2007 Adults 35+ by county US.png 3,587 × 2,306; 1.46 MB
-
Sweden flag waving icon.svg 44 × 28; 42 KB
-
Teen birth rates internationally, per 1000 girls aged 15-19 2008-ar.png 4,264 × 2,504; 235 KB
-
Teen birth rates internationally, per 1000 girls aged 15-19 2008.png 4,578 × 2,554; 316 KB
-
Temperature controlled truck clip art.svg 301 × 102; 82 KB
-
Two people talking.tiff 840 × 751; 2.9 MB
-
United Kingdom flag waving icon.svg 42 × 25; 76 KB
-
United States flag waving icon.svg 463 × 290; 78 KB
-
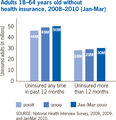
US adults 18-64 years old without health insurance, 2008-2010(Jan-Mar).png 1,883 × 1,954; 44 KB
-
US birth rates for teens 15-19 Years by Race-Ethnicity 1991 and 2009.png 1,809 × 1,701; 54 KB
-
US in circle icon.svg 98 × 98; 6 KB
-
US smoking percentages by gender, education, and poverty level.png 3,745 × 2,182; 146 KB
-
US teen birth rates by state per 1000 girls aged 15-19 years 2009.png 3,253 × 1,949; 462 KB
-
Vial of blood to be tested.tiff 423 × 840; 717 KB
-
Wine bottle icon.svg 22 × 98; 28 KB
-
Wine glass icon.svg 30 × 120; 30 KB
-
Yellow egg carton clip art.svg 88 × 60; 10 KB
-
Риски от курения.jpg 3,788 × 3,076; 1.26 MB


